Objectives for this activity
During this activity you will:
- Use the line of best fit for prediction.
- Identify for which range(s) of the explanatory variable the line should not be used to make predictions.
- Calculate a residual.
- Use a residual to determine if the line overpredicted or underpredicted the value of the response for a given observation.
- Calculate the standard error of the residuals.
- Use the standard error of the residuals to evaluate the accuracy of predictions from the line of best fit.
In the What to Know assignment preceding this activity, you summarized everything you’ve learned so far about linear regression analysis by performing one to predict the price of a house based on its size. In this activity, we’ll use the line of best fit to make predictions in a given scenario while learning about some new techniques. You will understand through this activity that a line of best fit can be used to predict the value of the response variable for a given value of the explanatory variable but that sometimes there are values of the explanatory variable in which the line of best fit should not be used for prediction, since predicting for these values would entail extrapolation. You’ll see that there is some error in each prediction; the line overpredicts for some observations and underpredicts for others. And you’ll learn that the standard error of the residuals can be used to evaluate the accuracy of predictions from the line as part of the overall assessment of the usefulness of the line for the data.
Movie Ratings

question 1
When deciding if you want to watch a movie, do you rely more on what professional movie critics think about a movie or what other regular moviegoers think about a movie?
In this in-class activity, we will use data from the movie ratings website Rotten Tomatoes (rottentomatoes.com). On this website, movie critics write reviews and regular moviegoers submit ratings (1–5 stars) for movies and TV shows. In this activity, we’ll focus on 125 movies from the website. We’ll use the following variables during today’s activity.
tomatometer: The “Tomatometer” score calculated as the percentage of professional movie and TV critics who write a positive review for the movie; the original name of this variable is rottentomatoes
audience_score: The percentage of the general public (regular moviegoers) who rate the movie 3.5 stars or higher (out of 5 stars); the original name of this variable is rottentomatos_user.
Guidance
[Intro: What was your answer to Question 1? Do you tend to care more about the technical qualities of a highly acclaimed film or do you just like what you like and want to hear what other people thought of a movie? Either way, a site like Rotten Tomatoes can help because it provides scores from both critics and regular moviegoers. You may want to try it out for yourself by going to rottentomatoes.com and searching for a movie you are interested in. If you do, what is the Tomatometer score? What is the audience score? For example, for the 2019 live-action remake of The Lion King, the Tomatometer score is 52% while the audience score is 88%. Why do you think there is such a large discrepancy between the critics’ score and the audience score? What types of factors do critics evaluate? How about audiences? Questions 2 and 3 below are a review of what you’ve already learned during this module. Answer them briefly among your group to assess your comfort level with these ideas. You should not spend much time on them.]
Line of Best Fit
Critics often see and review a movie before it’s released to the general public, so you want to use the line of best fit to predict how the general public (including you and your friends) will like a movie based on what the critics think.
question 2
What are the explanatory and response variables? Briefly explain how you made this determination.
question 3
Make a scatterplot of the two variables using the DCMP Linear Regression tool at https://dcmathpathways.shinyapps.io/LinearRegression/ and select the “Movie Ratings” dataset.
Part A: Use the scatterplot to describe the relationship between the Tomatometer and audience scores.
Part B: Use the tool to calculate the line of best fit. Write the equation of the line using customized variable names.
Extrapolation
Recall that you learned about extrapolation in Forming Connections [6B], where it was defined as is the prediction of a response value using an explanatory variable value that is outside the range of the original data. Use this idea to answer Question 4 below.
question 4
You and your friends want to watch a movie, and you’re considering five movies recommended by your peers. You have the Tomatometer score for each movie, but you want to get an idea of how a regular moviegoer might enjoy the movie to help you decide. To help figure this out, you decide to use your line of best fit to predict what the audience score is based on the Tomatometer score.
When calculating predicted values using a line of best fit, we should use it to calculate the predicted response for values of the explanatory variable within the range of values that are in the dataset. Using the model to predict for values of the explanatory variable far outside the range in our data is called extrapolation. We were introduced to extrapolation in Forming Connections [6B] when determining if it was reasonable to interpret the estimated y-intercept. We should avoid extrapolation in practice, since it is unreliable to assume the same line will best describe the relationship between the explanatory and response variables outside the range of our data.
Part A: If we used the line of best fit from the previous question to calculate predicted audience scores, for which Tomatometer scores would the estimates be considered extrapolation?
Part B: The following table shows the five movies you and your friends are considering, along with their Tomatometer scores. For which movie would making a prediction be considered an extrapolation?
| Movie | Tomatometer |
| Aladdin (2019) | 57 |
| Fantastic Four (2015) | 9 |
| Parasite | 98 |
| The Grinch | 58 |
| Avengers: Age of Ultron | 75 |
| Chaos Walking | 22 |
Prediction
Within the range of the explanatory variable, we can use the line of best fit to make predictions. Do this to answer Question 5. You’ll see in Question 6 that the line of best fit may over- or under-predict the value of the response variable for a given observation.
question 5
You are interested in calculating the predicted audience scores given the Tomatometer scores for the remaining five movies. In the following questions, you will calculate predictions and evaluate the accuracy of these predictions.
You can use the equation of the line directly to find the predicted values or allow the DCMP Linear Regression tool to perform the calculation for you. Under Regression Options, click Find Predicted Value and enter the Tomatometer score as the x-Value.
Part A: Complete the following table by calculating the predicted audience scores given the Tomatometer scores. Round your answer to 3 decimal places.
| Movie | Tomatometer | Predicted audience score |
| Aladdin (2019) | ||
| Parasite | ||
| The Grinch | ||
| Avengers: Age of Ultron | ||
| Chaos Walking |
Part B: Based on the predicted audience scores, which movie will you and your friends watch?
question 6
The actual audience scores for each movie are shown in the following table.
| Movie | Tomatometer | Audience score | Letter on scatterplot |
| Aladdin (2019) | 57 | 94 | |
| Parasite | 98 | 90 | |
| The Grinch | 58 | 50 | |
| Avengers: Age of Ultron | 75 | 83 | |
| Chaos Walking | 22 | 72 |
Part A: The following is a scatterplot of the audience score versus the Tomatometer. The movies from the previous question are red and labeled A through E on the plot. Fill in the previous table with the letter corresponding to each movie.
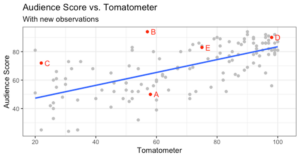
Part B: Did the line of best fit overpredict or underpredict the audience score for your movie? Explain using the scatterplot.
Part C: Look at the movies where the line underpredicted the audience score versus those where the line overpredicted the audience score. Are these results surprising? Explain.
We’ve seen how the line of best fit can be used to calculate predicted values, so now we want to make a general assessment of the accuracy of predictions from the line. To do so, we’ll look at the distribution of residuals specifically focusing on the variability.
Residual Standard Error
The residual standard error, [latex]s_e[/latex], is a measure of the variability in the residuals. It is the typical error we expect in predictions using the line of best fit. It is a way to quantify the spread of the points around the line of best fit on the scatterplot.
A large residual standard error indicates there is a lot of spread in the scatter of the points around the line of best fit and thus more variability in the residuals.
If all the data points fit perfectly on the line, the line is a perfect fit for the data and the residual standard error will be zero. This scenario almost never occurs in practice, since there is rarely data with observations that fall in a perfect line.
One thing to keep in mind is that the regression standard error has the same units as the response variable. Therefore, you want to keep the response variable, units, and context of the data in mind as you use the residual standard error to evaluate how well the line fits the data.
question 7
The formula for the residual standard error is:
[latex]s_e = \sqrt{\dfrac{1}{n-2}\left(y_i-\hat{y}_i\right)^{2}}[/latex]
In practice, you will use technology to calculate this value.
Part A: Use the regression tool to calculate the residual standard error. This can be found in the “Model Summary” under the value of the coefficient of determination.
Part B: Based on the residual standard error, would you recommend using this line of best fit to predict the audience score for a movie based on the Tomatometer? Explain.
Guidance
[Wrap-up: Were you surprised by any of the predictions from the line of best fit? How do you think you can reasonably use the line to make predictions within a dataset such as this one? What does the line tell you about the relationship between how critics like a move versus how general audiences feel about a move? Again, we see that statistics provides us mathematical tools for analyzing and understanding a relationship present in the data, but it is up to us to make any decisions based on that relationship only after careful and thorough consideration. ]
