Overview
- Students will apply the Empirical Rule within a medical context to determine “unusual” observations.
- Students are introduced to a quantifiable measure to compare observations using standardized units and determine if an observation is outside the range of usual values.
- This activity connects back to measures of center and spread, and connects forward to probability distributions and hypothesis testing.
- V4, O3, S4, C5, O4, C3, V1, C4, S2, O2 ← Link to EBTP descriptions
Prerequisite assumptions
Students should be able to do each of the following after completing the What to Know assignment.
- Convert values into standardized scores.
- Use a value’s standardized score to determine whether the value is above, below, or equal to the mean.
- Explain the Empirical Rule.
Intended goals for this activity
After completing this activity, students should understand that Standardized scores and the Empirical Rule can be used to determine if an observation is usual or unusual.. They should be able to utilize standardized scores and the Empirical Rule to determine if an observation is unusual and to compare two observations by calculating and comparing the standardized score.
Synchronous Delivery and Activity Flow
The sample activity delivery below assumes a face-to-face class meeting but can be adapted to a fully online or hybrid delivery by using break-out rooms for pairs and small groups.
Frame the activity (3 minutes)
- Have students read and answer Question 1 independently. Then, have students discuss their answers in pairs before sharing with the full group. V4
- Transition to the in-class activity by briefly discussing the objectives for the activity.
Activity Flow (18 minutes)
- Use the last part of Question 1—“Are there alternatives to having human volunteers participate in clinical trials?”—to lead into the two paragraphs that follow the objectives.
- If it hasn’t come up already, mention that one alternative to testing on humans is testing on mice. Then have students read both paragraphs individually.
- Make sure to give students enough time to process the information they have read individually first. O3
- In pairs, have students formulate any questions they might have about this context. Have the pairs share their questions and address them. Possible questions may come up about the meaning of “genome” (an organism’s complete set of genetic instructions) and “toxicity” (the degree to which a toxin or poison can harm humans or animals) and why organ weight is used to measure toxicity (organ weight changes are indicators of chemically-induced organ damage. Hence, changes in organ weight are often associated with treatment-related effects.). The student activity page also links to the website https://www.yourgenome.org/facts/what-is-a-genome. S4
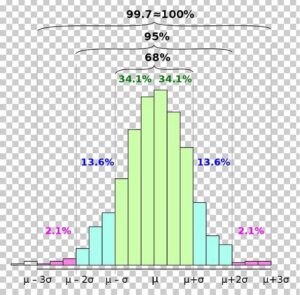
- Have students work on Questions 2 and 3 in pairs or small groups. You may wish to assign half the groups to Questions 2 and half to Question 3 before bringing everyone together to share their results. It may be helpful to display a graphical representation of the Empirical Rule.
This is the one they were introduced to in the What to Know assignment .
- If students have difficulty with these questions, point back to the listed means and standard deviations. Using the horizontal axis on the chart, ask: “What values are associated with 68% of the data?” [Answer: One standard deviation greater than the mean and one standard deviation less than the mean ] C5
- Bring the whole-class together to summarize these questions before continuing. O4
- Students may have difficulty answering Question 4. It’s okay to mention that an observation that is two standard deviations from the mean is considered unusual. Point back to the chart and ask: “What percentage of the data is within two standard deviations of the mean?” [Answer: 95%] Follow up questions include:
- “In this context, between which two values are 95% of the data?” [Answer: 0.825 g and 1.173 g for liver and 0.072 g and 0.100 g for spleen]
- Have students identify a value that is not within 0.825 g and 1.173 g for livers and not within 0.072 g and 0.100 g for spleens.
- Bring the whole-class together to debrief this question by having groups share a few unusual values. Make sure to discuss values that are more than two standard deviations above AND below the mean. C3
- For Question 5, you can display the formula [latex]z=\dfrac{\bar{x}-\mu}{\sigma} and develop the inclination for students to talk about "standard deviations from the mean."
Wrap-up/transition (5 minutes)
- Have students share their answers to Question 5. V1
- Ensure students are communicating appropriately using statistical terms. In this question, the liver weight of [latex]1.07[/latex]g is [latex]0.816[/latex] standard deviations above the mean and the spleen weight of [latex]0.104[/latex]g is [latex]2.571[/latex] standard deviations above the mean. C4
- The spleen shows a higher level of toxicity because the weight of the spleen is highly unusual at 2.571 standard deviations above the mean, whereas the liver weight is within one standard deviation above the mean.
- Make sure students understand that z-scores do not have units associated with them.
- Have students refer back to the Objectives for the activity and identify ones they recognized completing. S2, C4, O2
- Assign the homework or Practice and any What to Know pages for the Forming Connections activities you plan to complete in the next class meeting. C2
