Learning Outcomes
- Graph a line given the slope and a point on the line
- Solve slope applications
In this chapter, we graphed lines by plotting points, by using intercepts, and by recognizing horizontal and vertical lines.
Another method we can use to graph lines is the point-slope method. Sometimes, we will be given one point and the slope of the line, instead of its equation. When this happens, we use the definition of slope to draw the graph of the line.
example
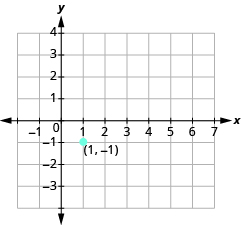
Graph the line passing through the point [latex]\left(1,-1\right)[/latex] whose slope is [latex]m=\Large\frac{3}{4}[/latex].
Solution
Plot the given point, [latex]\left(1,-1\right)[/latex].
Use the slope formula [latex]m=\Large\frac{\text{rise}}{\text{run}}[/latex] to identify the rise and the run.
[latex]\begin{array}{}\\ \\ m=\frac{3}{4}\hfill \\ \frac{\text{rise}}{\text{run}}=\frac{3}{4}\hfill \\ \\ \\ \text{rise}=3\hfill \\ \text{run}=4\hfill \end{array}[/latex]
Starting at the point we plotted, count out the rise and run to mark the second point. We count [latex]3[/latex] units up and [latex]4[/latex] units right.
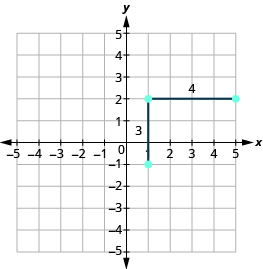
Then we connect the points with a line and draw arrows at the ends to show it continues.
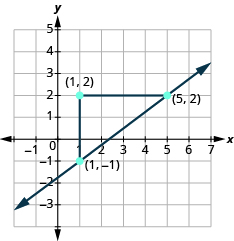
We can check our line by starting at any point and counting up [latex]3[/latex] and to the right [latex]4[/latex]. We should get to another point on the line.
try it
Graph a line given a point and a slope
- Plot the given point.
- Use the slope formula to identify the rise and the run.
- Starting at the given point, count out the rise and run to mark the second point.
- Connect the points with a line.
example
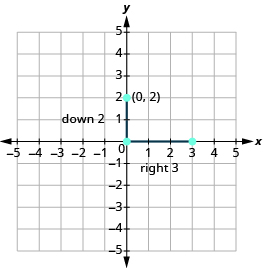
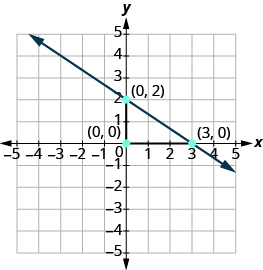
Graph the line with [latex]y[/latex] -intercept [latex]\left(0,2\right)[/latex] and slope [latex]m=-\Large\frac{2}{3}[/latex]

try it
example
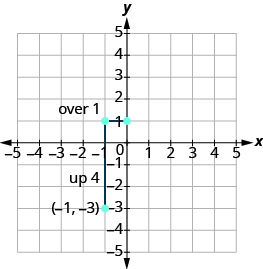
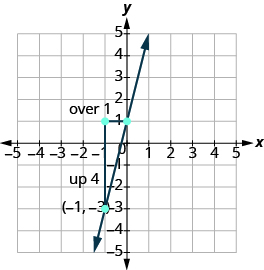
Graph the line passing through the point [latex]\left(-1,-3\right)[/latex] whose slope is [latex]m=4[/latex]

try it
Solve Slope Applications
At the beginning of this section, we said there are many applications of slope in the real world. Let’s look at a few now.
example
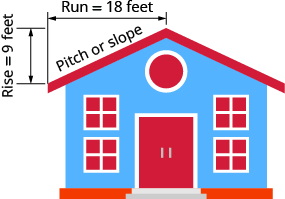
The pitch of a building’s roof is the slope of the roof. Knowing the pitch is important in climates where there is heavy snowfall. If the roof is too flat, the weight of the snow may cause it to collapse. What is the slope of the roof shown?
try it
example
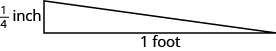
Have you ever thought about the sewage pipes going from your house to the street? Their slope is an important factor in how they take waste away from your house.
Sewage pipes must slope down [latex]{\Large\frac{1}{4}}[/latex] inch per foot in order to drain properly. What is the required slope?
try it
In the following video we show another example of how to graph a line given a point on the line and the slope of the line.
Candela Citations
- Question ID 147028, 147027, 147026. Authored by: Lumen Learning. License: CC BY: Attribution
- Ex: Graph a Line Given a Point and the Slope. Authored by: James Sousa (mathispower4u.com). Located at: https://youtu.be/ngpAgpMjozw. License: CC BY: Attribution
- Prealgebra. Provided by: OpenStax. License: CC BY: Attribution. License Terms: Download for free at http://cnx.org/contents/caa57dab-41c7-455e-bd6f-f443cda5519c@9.757
