Learning Outcomes
- Identify the x and y-intercepts of a line given in equation form
- Identify the x and y-intercepts of a line given in graph form
Every linear equation has a unique line that represents all the solutions of the equation. When graphing a line by plotting points, each person who graphs the line can choose any three points, so two people graphing the line might use different sets of points.
At first glance, their two lines might appear different since they would have different points labeled. But if all the work was done correctly, the lines will be exactly the same line. One way to recognize that they are indeed the same line is to focus on where the line crosses the axes. Each of these points is called an intercept of the line.
Intercepts of a Line
Each of the points at which a line crosses the [latex]x\text{-axis}[/latex] and the [latex]y\text{-axis}[/latex] is called an intercept of the line.
Let’s look at the graph of the lines shown below.
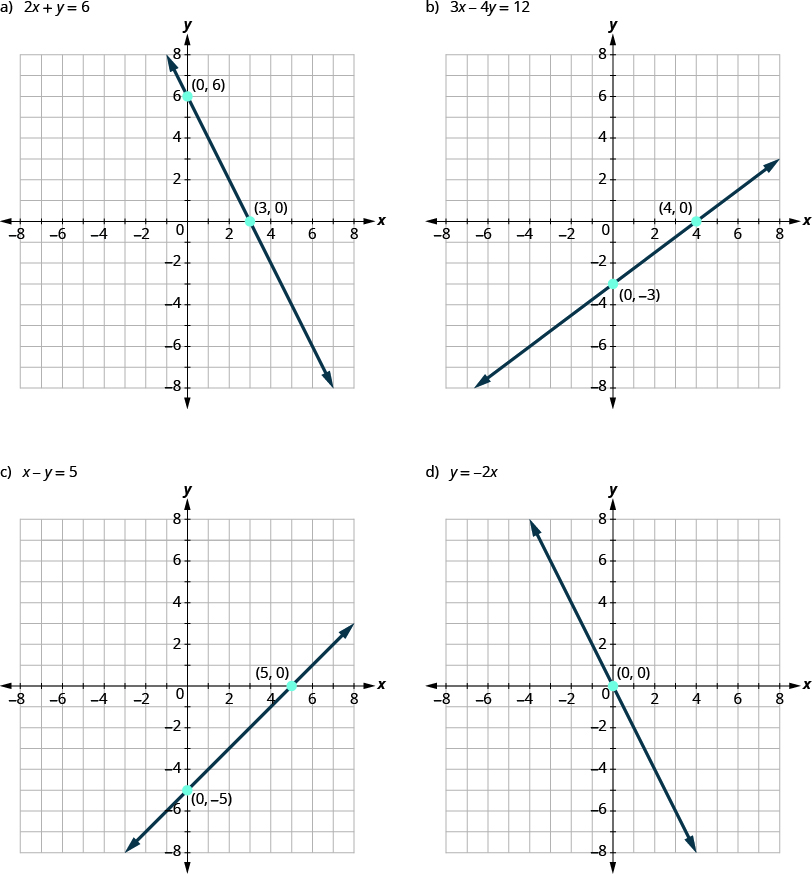
First, notice where each of these lines crosses the x– axis:
| Figure: | The line crosses the x-axis at: | Ordered pair of this point |
|---|---|---|
| [latex]a[/latex] | [latex]3[/latex] | [latex](3,0)[/latex] |
| [latex]b[/latex] | [latex]4[/latex] | [latex](4,0)[/latex] |
| [latex]b[/latex] | [latex]5[/latex] | [latex](5,0)[/latex] |
| [latex]d[/latex] | [latex]0[/latex] | [latex](0,0)[/latex] |
Do you see a pattern?
For each row, the y- coordinate of the point where the line crosses the x- axis is zero. The point where the line crosses the x- axis has the form [latex]\left(a,0\right)[/latex] ; and is called the x-intercept of the line. The x- intercept occurs when y is zero.
Now, let’s look at the points where these lines cross the y-axis.
| Figure: | The line crosses the y-axis at: | Ordered pair for this point |
|---|---|---|
| [latex]a[/latex] | [latex]6[/latex] | [latex](0,6)[/latex] |
| [latex]b[/latex] | [latex]-3[/latex] | [latex](0,-3)[/latex] |
| [latex]c[/latex] | [latex]-5[/latex] | [latex](0,-5)[/latex] |
| [latex]d[/latex] | [latex]0[/latex] | [latex](0,0)[/latex] |
x- intercept and y- intercept of a line
The [latex]x\text{-intercept}[/latex] is the point, [latex]\left(a,0\right)[/latex], where the graph crosses the [latex]x\text{-axis}[/latex]. The [latex]x\text{-intercept}[/latex] occurs when [latex]\text{y}[/latex] is zero.
The [latex]y\text{-intercept}[/latex] is the point, [latex]\left(0,b\right)[/latex], where the graph crosses the [latex]y\text{-axis}[/latex]. The [latex]y\text{-intercept}[/latex] occurs when [latex]\text{x}[/latex] is zero.
example
Find the [latex]x\text{- and }y\text{-intercepts}[/latex] of each line:
| 1. [latex]x+2y=4[/latex] | 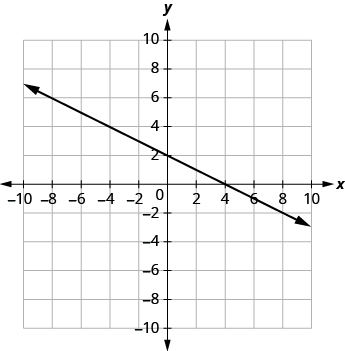 |
| 2. [latex]3x-y=6[/latex] | 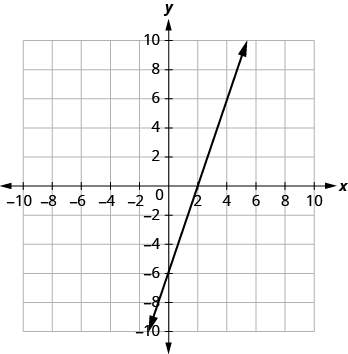 |
| 3. [latex]x+y=-5[/latex] | 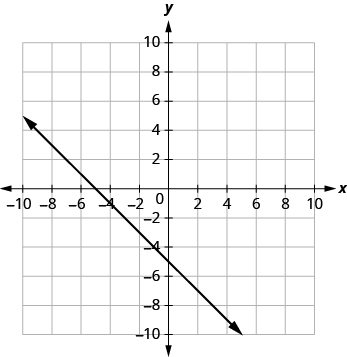 |
Solution
| 1. | |
| The graph crosses the x-axis at the point [latex](4, 0)[/latex]. | The x-intercept is [latex](4, 0)[/latex]. |
| The graph crosses the y-axis at the point [latex](0, 2)[/latex]. | The y-intercept is [latex](0, 2)[/latex]. |
| 2. | |
| The graph crosses the x-axis at the point [latex](2, 0)[/latex]. | The x-intercept is [latex](2, 0)[/latex] |
| The graph crosses the y-axis at the point [latex](0, −6)[/latex]. | The y-intercept is [latex](0, −6)[/latex]. |
| 3. | |
| The graph crosses the x-axis at the point [latex](−5, 0)[/latex]. | The x-intercept is [latex](−5, 0)[/latex]. |
| The graph crosses the y-axis at the point [latex](0, −5)[/latex]. | The y-intercept is [latex](0, −5)[/latex]. |
try it
Recognizing that the [latex]x\text{-intercept}[/latex] occurs when [latex]y[/latex] is zero and that the [latex]y\text{-intercept}[/latex] occurs when [latex]x[/latex] is zero gives us a method to find the intercepts of a line from its equation. To find the [latex]x\text{-intercept,}[/latex] let [latex]y=0[/latex] and solve for [latex]x[/latex]. To find the [latex]y\text{-intercept}[/latex], let [latex]x=0[/latex] and solve for [latex]y[/latex].
In the following video, we provide another example of how to find the intercepts of a line from a graph.
Find the x and y from the Equation of a Line
Use the equation to find:
the x-intercept of the line, let [latex]y=0[/latex] and solve for x.
the y-intercept of the line, let [latex]x=0[/latex] and solve for y.
| [latex]x[/latex] | [latex]y[/latex] |
|---|---|
| [latex]0[/latex] | |
| [latex]0[/latex] |
example
Find the intercepts of [latex]2x+y=6[/latex]
We’ll fill in the table below.
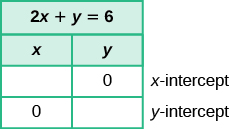
To find the x- intercept, let [latex]y=0[/latex] :
| [latex]2x+y=6[/latex] | |
| Substitute [latex]0[/latex] for y. | [latex]2x+\color{red}{0}=6[/latex] |
| Add. | [latex]2x=6[/latex] |
| Divide by [latex]2[/latex]. | [latex]x=3[/latex] |
| The x-intercept is [latex](3, 0)[/latex]. |
To find the y- intercept, let [latex]x=0[/latex] :
| [latex]2x+y=6[/latex] | |
| Substitute [latex]0[/latex] for x. | [latex]2\cdot\color{red}{0}+y=6[/latex] |
| Multiply. | [latex]0+y=6[/latex] |
| Add. | [latex]y=6[/latex] |
| The y-intercept is [latex](0, 6)[/latex]. |
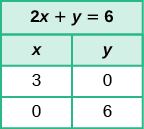
The intercepts are the points [latex]\left(3,0\right)[/latex] and [latex]\left(0,6\right)[/latex] .
try it
example
Find the intercepts of [latex]4x - 3y=12[/latex]
try it
In the following example we show you how to find the intercepts of a line given in a different form than the examples above.
Candela Citations
- Question ID 146997, 146996, 146950. Authored by: Lumen Learning. License: CC BY: Attribution
- Ex: State the X and Y Intercepts Given the Graph of a Line. Located at: https://youtu.be/m5eQ_SjLVuw. License: CC BY: Attribution
- Ex: Determine the x and y Intercepts of a Linear Equation in Slope Intercept Form. Authored by: James Sousa (mathispower4u.com). Located at: https://youtu.be/vmaMT188ChA. License: CC BY: Attribution
- Prealgebra. Provided by: OpenStax. License: CC BY: Attribution. License Terms: Download for free at http://cnx.org/contents/caa57dab-41c7-455e-bd6f-f443cda5519c@9.757
