Learning Outcomes
- Use a spreadsheet to explore measures of central tendency of a data set
- Use a spreadsheet to explore measures of spread and variation of a data set
now its your turn
Practice putting the entire sheet together and performing an analysis of the descriptive statistics on your own. The solutions are presented for each step, but don’t peek until you have completed each one!
A downtown historic district has taken a census of the average dinner plate price at all the main-street restaurants. They are displayed in the table below, rounded to the nearest dollar.
| 7 |
7 |
7 |
8 |
8 |
8 |
| 8 |
8 |
8 |
12 |
12 |
12 |
| 13 |
13 |
14 |
17 |
17 |
18 |
| 22 |
23 |
25 |
27 |
32 |
47 |
Hands-on Spreadsheet: Explore the Data
step 1
Store the data in a new sheet named Menu Prices.
step 2
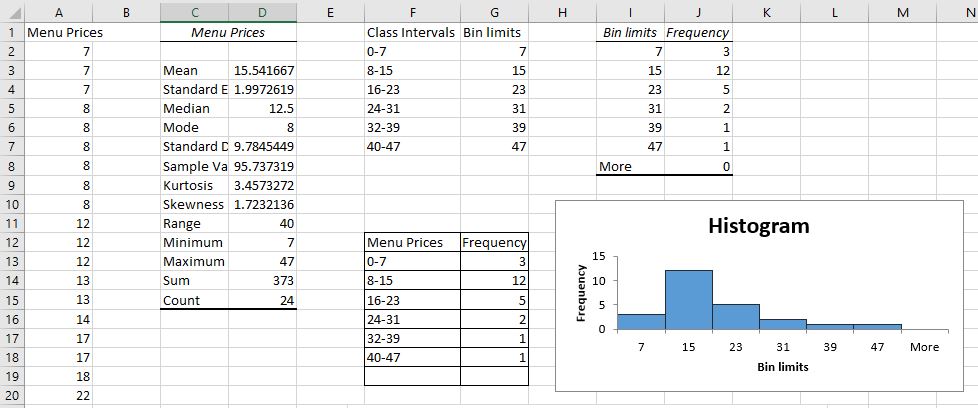
Obtain the descriptive statistics. What are the mean, median, and mode? What is the standard deviation? Does the data appear to be tightly centered or more spread out? What is the skewness? Does the mean appear to have been pulled left or right of center by any extra large or extra small values?
Step 3
Now create a frequency table and histogram. Use 6 intervals beginning with 0-7.
step 4
Create a 5-number summary and box plot.
step 5
Analyze the data.
Solution
The price range at the downtown restaurants is wide, from $7 to $47 per plate. We can easily see in the histogram that most places charge $8 – $15 on average. But since these average prices, we don’t really have information about the individual ranges at each restaurant. We see that we have one very extreme value of $47 per plate. It would be interesting to find out how many and how expensive that restaurant truly is (or is one extremely pricey dinner, say surf and turf at market prices, pulling the mean up there?). We also might wonder about the three restaurants with average dinner plates of $0 – $7. Are they factoring in the kids menu or a senior menu at a very casual sandwich shop to bring the average cost down? Or are there a couple of hot dog vendors with permanent corner spots? Not being able to answer those questions without further study, we can at least safely report an array of 19 affordable places to eat downtown.
Note the skewness of 1.72 in the list of descriptive statistics. We could have know just by looking at that that we had an outlier present. Any skewness over 1 is at least fairly significant. but we can also see that the median value is 12.5 while the mean is 15.5. That’s a significant pull to the right, indicating the right skew and the presence of at least one unusually high value in the data set.
The standard deviation of the data at 9.87 tells us that the average plate varies from the center by about $10. The spread lets us know that dining options downtown are are highly variable. This is visually apparent from the box plot, where the bulk of the prices sit low on the graph, huddled close together and the whisker stretches upward toward the high-priced outlier. So, we could say that a diner without a plan could reasonably expect to pay between $3 (maybe for a corner hot dog) and $22.50 for a restaurant experience. Of course, they could always spring for lobster and a filet.