- The table below shows scores on a Math test.
- Complete the frequency table for the Math test scores
- Construct a histogram of the data
80 50 50 90 70 70 100 60 70 80 70 50 90 100 80 70 30 80 80 70 100 60 60 50
- A group of adults where asked how many cars they had in their household
- Complete the frequency table for the car number data
- Construct a histogram of the data
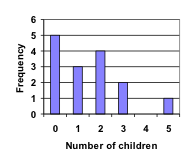
1 4 2 2 1 2 3 3 1 4 2 2 1 2 1 3 2 2 1 2 1 1 1 2 - A group of adults were asked how many children they have in their families. The bar graph to the right shows the number of adults who indicated each number of children.
- How many adults where questioned?
- What percentage of the adults questioned had 0 children?
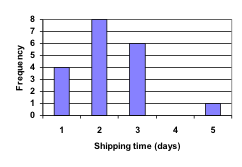
- Jasmine was interested in how many days it would take an order from Netflix to arrive at her door. The graph below shows the data she collected.
- How many movies did she order?
- What percentage of the movies arrived in one day?
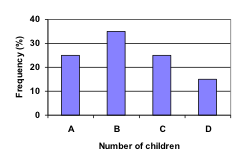
- The bar graph below shows the percentage of students who received each letter grade on their last English paper. The class contains 20 students. What number of students earned an A on their paper?
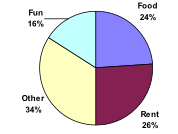
- Kori categorized her spending for this month into four categories: Rent, Food, Fun, and Other. The percents she spent in each category are pictured here. If she spent a total of $2600 this month, how much did she spend on rent?
- A group of diners were asked how much they would pay for a meal. Their responses were: $7.50, $8.25, $9.00, $8.00, $7.25, $7.50, $8.00, $7.00.
- Find the mean
- Find the median
- Write the 5-number summary for this data
- You recorded the time in seconds it took for 8 participants to solve a puzzle. The times were: 15.2, 18.8, 19.3, 19.7, 20.2, 21.8, 22.1, 29.4.
- Find the mean
- Find the median
- Write the 5-number summary for this data
- Refer back to the histogram from question #3.
- Compute the mean number of children for the group surveyed
- Compute the median number of children for the group surveyed
- Write the 5-number summary for this data
- Create box plot
- Refer back to the histogram from question #4.
- Computer the mean number of shipping days
- Compute the median number of shipping days
- Write the 5-number summary for this data
- Create box plot
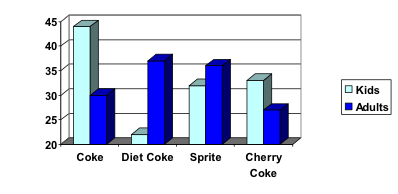
- A graph appears below showing the number of adults and children who prefer each type of soda. There were 130 adults and kids surveyed. Discuss some ways in which the graph below could be improved.
- In your class, design a poll on a topic of interest to you and give it to the class.
- Summarize the data, computing the mean and five-number summary.
- Create a graphical representation of the data.
- Write several sentences about the topic, using your computed statistics as evidence in your writing.
- X ~ N(1,2). What is σ?
- X ~ N(-4,1). What is μ?
- What is the z-score of x = 12, if it is two standard deviations to the right of the mean?
- What is the z-score of x = 9, if it is 1.5 standard deviations to the left of the mean?
- What is the z-score of x = –2, if it is 2.78 standard deviations to the right of the mean?
- Suppose X ~ N(2, 6). What value of x has a z-score of three?
- Suppose X ~ N(8, 1). What value of x has a z-score of –2.25?
- Suppose X ~ N(9, 5). What value of x has a z-score of –0.5?
- Suppose X ~ N(4, 2). What value of x is 1.5 standard deviations to the left of the mean?
- Suppose X ~ N(4, 2). What value of x is two standard deviations to the right of the mean?
- Suppose X ~ N(8, 9). What value of x is 0.67 standard deviations to the left of the mean?
- Suppose X ~ N(–1, 2). What is the z-score of x = 2?
- Suppose X ~ N(12, 6). What is the z-score of x = 2?
- Suppose X ~ N(9, 3). What is the z-score of x = 9?
- In a normal distribution, x = 5 and z = –1.25. This tells you that x = 5 is ____ standard deviations to the ____ (right or left) of the mean.
- In a normal distribution, x = 3 and z = 0.67. This tells you that x = 3 is ____ standard deviations to the ____ (right or left) of the mean.
- In a normal distribution, x = –2 and z = 6. This tells you that x = –2 is ____ standard deviations to the ____ (right or left) of the mean.
- About what percent of x values from a normal distribution lie within one standard deviation (left and right) of the mean of that distribution?
- About what percent of the x values from a normal distribution lie within two standard deviations (left and right) of the mean of that distribution?
- About what percent of x values lie between the second and third standard deviations (both sides)?
- Suppose X ~ N(15, 3). Between what x values does 68.27% of the data lie? The range of x values is centered at the mean of the distribution (i.e., 15).
- Suppose X ~ N(–3, 1). Between what x values does 95.45% of the data lie? The range of x values is centered at the mean of the distribution(i.e., –3).
- The heights of the 430 National Basketball Association players were listed on team rosters at the start of the 2005–2006 season. The heights of basketball players have an approximate normal distribution with mean, µ = 79 inches and a standard deviation, σ = 3.89 inches. For each of the following heights, calculate the z-score and interpret it using complete sentences.
- 77 inches
- 85 inches
- The patient recovery time from a particular surgical procedure is normally distributed with a mean of 5.3 days and a standard deviation of 2.1 days.
- What is the z-score for a patient who takes 10 days to recover?
- What is the probability of spending more than 2 days in recovery?
- The 90th percentile for recovery time is?
- The systolic blood pressure (given in millimeters) of males has an approximately normal distribution with mean µ = 125 and standard deviation σ = 14. Systolic blood pressure for males follows a normal distribution.
- Calculate the z-scores for the male systolic blood pressures 100 and 150 millimeters.
- If a male friend of yours said he thought his systolic blood pressure was 2.5 standard deviations below the mean, but that he believed his blood pressure was between 100 and 150 millimeters, what would you say to him?
- If the area to the left of x in a normal distribution is 0.123, what is the area to the right of x?
- If the area to the right of x in a normal distribution is 0.543, what is the area to the left of x?
- X ~ N(54,8)
- Find the probability that x > 56.
- Find the probability that x < 30.
- Find the 80th percentile.
- Find the 60th percentile.
Candela Citations
CC licensed content, Shared previously
- Describing Data Problem Set. Authored by: Lippman, David. Located at: http://www.opentextbookstore.com/mathinsociety/. License: CC BY: Attribution