Learning Objectives
- Define the domain of functions from graphs
- One-to-one functions
- Use the horizontal line test to determine whether a function is one-to-one
Functions are a correspondence between two sets, called the domain and the range. When defining a function, you usually state what kind of numbers the domain (x) and range (f(x)) values can be. But even if you say they are real numbers, that doesn’t mean that all real numbers can be used for x. It also doesn’t mean that all real numbers can be function values, f(x). There may be restrictions on the domain and range. The restrictions partly depend on the type of function.
In this topic, all functions will be restricted to real number values. That is, only real numbers can be used in the domain, and only real numbers can be in the range.
There are two main reasons why domains are restricted.
- You can’t divide by 0.
- You can’t take the square (or other even) root of a negative number, as the result will not be a real number.
Find Domain and Range From a Graph
Finding domain and range of different functions is often a matter of asking yourself, what values can this function not have? Pictures make it easier to visualize what domain and range are, so we will show how to define the domain and range of functions given their graphs.
What are the domain and range of the real-valued function [latex]f(x)=x+3[/latex]?
This is a linear function. Remember that linear functions are lines that continue forever in each direction.
Any real number can be substituted for x and get a meaningful output. For any real number, you can always find an x value that gives you that number for the output. Unless a linear function is a constant, such as [latex]f(x)=2[/latex], there is no restriction on the range.
The domain and range are all real numbers.
For the examples that follow, try to figure out the domain and range of the graphs before you look at the answer.
Example
What are the domain and range of the real-valued function [latex]f(x)=−3x^{2}+6x+1[/latex]?
Example
What is the domain and range of the real-valued function [latex]f(x)=-2+\sqrt{x+5}[/latex]?
Division by 0 could happen whenever the function has a variable in the denominator of a rational expression. That is, it’s something to look for in rational functions. Look at these examples, and note that “division by 0” doesn’t necessarily mean that x is 0! The following is an example of rational function, w will cover these in detail later.
Example
What is the domain of the real-valued function [latex]\displaystyle f(x)=\frac{3x}{x+2}[/latex]?
In the following video we show how to define the domain and range of functions from their graphs.
Example: Finding Domain and Range from a Graph
Find the domain and range of the function [latex]f[/latex].
![Graph of a function from (-3, 1].](https://s3-us-west-2.amazonaws.com/courses-images/wp-content/uploads/sites/2862/2017/12/26165219/CNX_Precalc_Figure_01_02_0072.jpg)

Try It
Example: Finding Domain and Range from a Graph of Oil Production
Find the domain and range of the function [latex]f[/latex].
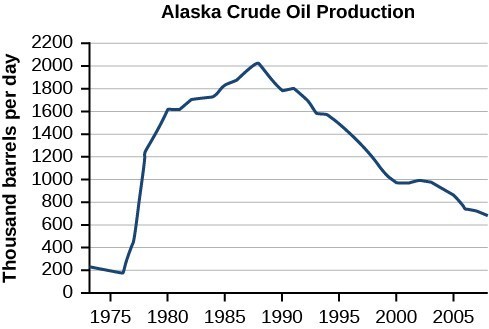
(credit: modification of work by the U.S. Energy Information Administration)
Try It
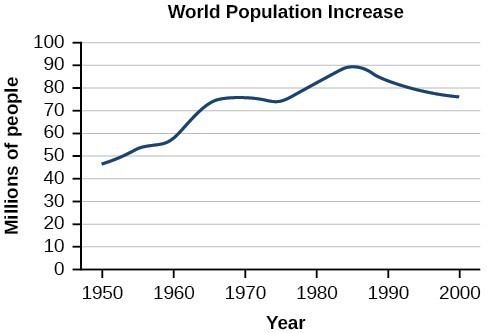
Given the graph, identify the domain and range using interval notation.
Identify a One-to-One Function
Remember that in a function, the input value must have one and only one value for the output. There is a name for the set of input values and another name for the set of output values for a function. The set of input values is called the domain of the function. And the set of output values is called the range of the function.
In the first example we remind you how to define domain and range using a table of values.
Example
Find the domain and range for the function.
|
x |
y |
|---|---|
|
−5 |
−6 |
|
−2 |
−1 |
|
−1 |
0 |
|
0 |
3 |
|
5 |
15 |
In the following video we show another example of finding domain and range from tabular data.
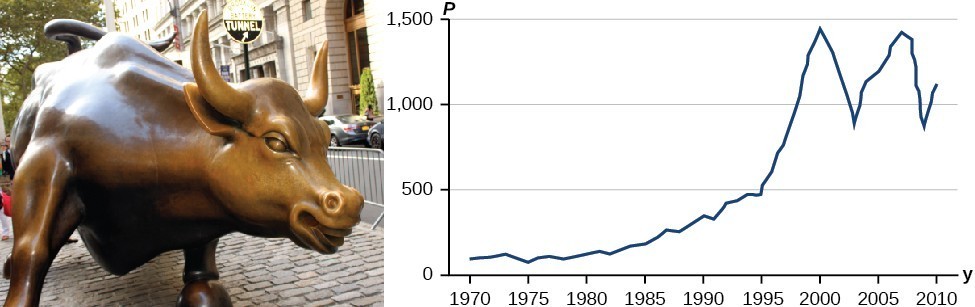
Some functions have a given output value that corresponds to two or more input values. For example, in the following stock chart the stock price was $1000 on five different dates, meaning that there were five different input values that all resulted in the same output value of $1000.
However, some functions have only one input value for each output value, as well as having only one output for each input. We call these functions one-to-one functions. As an example, consider a school that uses only letter grades and decimal equivalents, as listed in.
| Letter grade | Grade point average |
|---|---|
| A | 4.0 |
| B | 3.0 |
| C | 2.0 |
| D | 1.0 |
This grading system represents a one-to-one function, because each letter input yields one particular grade point average output and each grade point average corresponds to one input letter.
To visualize this concept, let’s look again at the two simple functions sketched in (a)and (b) of Figure 10.
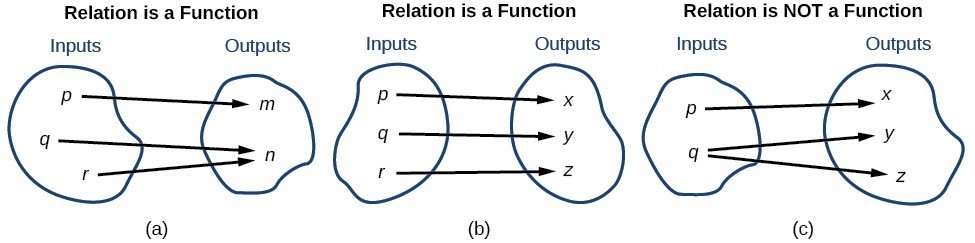
Figure 10
The function in part (a) shows a relationship that is not a one-to-one function because inputs [latex]q[/latex] and [latex]r[/latex] both give output [latex]n[/latex]. The function in part (b) shows a relationship that is a one-to-one function because each input is associated with a single output.
A General Note: One-to-One Function
A one-to-one function is a function in which each output value corresponds to exactly one input value.
Example
Which table represents a one-to-one function?
a)
| input | output |
| 1 | 5 |
| 12 | 2 |
| 0 | -1 |
| 4 | 2 |
| -5 | 0 |
b)
| input | output |
| 4 | 8 |
| 8 | 16 |
| 16 | 32 |
| 32 | 64 |
| 64 | 128 |
In the following video, we show an example of using tables of values to determine whether a function is one-to-one.
Using the Horizontal Line Test
An easy way to determine whether a function is a one-to-one function is to use the horizontal line test on the graph of the function. To do this, draw horizontal lines through the graph. If any horizontal line intersects the graph more than once, then the graph does not represent a one-to-one function.
How To: Given a graph of a function, use the horizontal line test to determine if the graph represents a one-to-one function.
- Inspect the graph to see if any horizontal line drawn would intersect the curve more than once.
- If there is any such line, determine that the function is not one-to-one.
Exercises
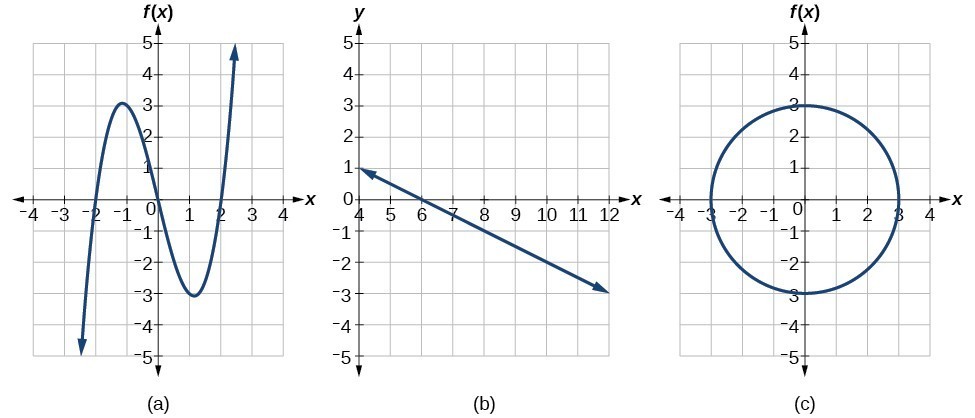
For the following graphs, determine which represent one-to-one functions.


The following video provides another example of using the horizontal line test to determine whether a graph represents a one-to-one function.
Summary
In real life and in algebra, different variables are often linked. When a change in value of one variable causes a change in the value of another variable, their interaction is called a relation. A relation has an input value which corresponds to an output value. When each input value has one and only one output value, that relation is a function. Functions can be written as ordered pairs, tables, or graphs. The set of input values is called the domain, and the set of output values is called the range.
Candela Citations
- Revision and Adaptation. Provided by: Lumen Learning. License: CC BY: Attribution
- College Algebra. Provided by: OpenStax. Located at: http://cnx.org/contents/fd53eae1-fa23-47c7-bb1b-972349835c3c@5.175. License: CC BY: Attribution. License Terms: Download for Free at: http://cnx.org/contents/fd53eae1-fa23-47c7-bb1b-972349835c3c@5.175
- Unit 17: Functions, from Developmental Math: An Open Program. Provided by: Monterey Institute of Technology and Education. Located at: http://nrocnetwork.org/dm-opentext. License: CC BY: Attribution
- Ex 1: Determine the Domain and Range of the Graph of a Function. Authored by: James Sousa (Mathispower4u.com) for Lumen Learning. Located at: https://youtu.be/QAxZEelInJc. License: CC BY: Attribution
- Determine if a Relation Given as a Table is a One-to-One Function. Authored by: James Sousa (Mathispower4u.com) for Lumen Learning. Located at: https://youtu.be/QFOJmevha_Y. License: CC BY: Attribution
- Question ID#2316. Authored by: Lippman,David. License: CC BY: Attribution