Learning Outcomes
- Graph linear functions.
- Write the equation for a linear function from the graph of a line.
- Write the equation of a line parallel or perpendicular to a given line.
Two competing telephone companies offer different payment plans. The two plans charge the same rate per long distance minute, but charge a different monthly flat fee. A consumer wants to determine whether the two plans will ever cost the same amount for a given number of long distance minutes used. The total cost of each payment plan can be represented by a linear function. To solve the problem, we will need to compare the functions. In this section, we will consider methods of comparing functions using graphs.
Graphing Linear Functions
In Linear Functions, we saw that that the graph of a linear function is a straight line. We were also able to see the points of the function as well as the initial value from a graph. By graphing two functions, then, we can more easily compare their characteristics.
There are three basic methods of graphing linear functions. The first is by plotting points and then drawing a line through the points. The second is by using the y-intercept and slope. And the third is by using transformations of the identity function [latex]f(x)=x[/latex].
Graphing a Function by Plotting Points
To find points of a function, we can choose input values, evaluate the function at these input values, and calculate output values. The input values and corresponding output values form coordinate pairs. We then plot the coordinate pairs on a grid. In general, we should evaluate the function at a minimum of two inputs in order to find at least two points on the graph. For example, given the function, [latex]f(x)=2x[/latex], we might use the input values 1 and 2. Evaluating the function for an input value of 1 yields an output value of 2, which is represented by the point (1, 2). Evaluating the function for an input value of 2 yields an output value of 4, which is represented by the point (2, 4). Choosing three points is often advisable because if all three points do not fall on the same line, we know we made an error.
How To: Given a linear function, graph by plotting points.
- Choose a minimum of two input values.
- Evaluate the function at each input value.
- Use the resulting output values to identify coordinate pairs.
- Plot the coordinate pairs on a grid.
- Draw a line through the points.
Example 1: Graphing by Plotting Points
Graph [latex]f\left(x\right)=-\frac{2}{3}x+5[/latex] by plotting points.
![The graph of the linear function [latex]f\left(x\right)=-\frac{2}{3}x+5[/latex].](https://s3-us-west-2.amazonaws.com/courses-images-archive-read-only/wp-content/uploads/sites/1227/2015/04/03010644/CNX_Precalc_Figure_02_02_0012.jpg)
Try It
Graph [latex]f\left(x\right)=-\frac{3}{4}x+6[/latex] by plotting points.

Graphing a Linear Function Using y-intercept and Slope
Another way to graph linear functions is by using specific characteristics of the function rather than plotting points. The first characteristic is its y-intercept, which is the point at which the input value is zero. To find the y-intercept, we can set x = 0 in the equation.
The other characteristic of the linear function is its slope m, which is a measure of its steepness. Recall that the slope is the rate of change of the function. The slope of a function is equal to the ratio of the change in outputs to the change in inputs. Another way to think about the slope is by dividing the vertical difference, or rise, by the horizontal difference, or run. We encountered both the y-intercept and the slope in Linear Functions.
Let’s consider the following function.
[latex]f\left(x\right)=\frac{1}{2}x+1[/latex]
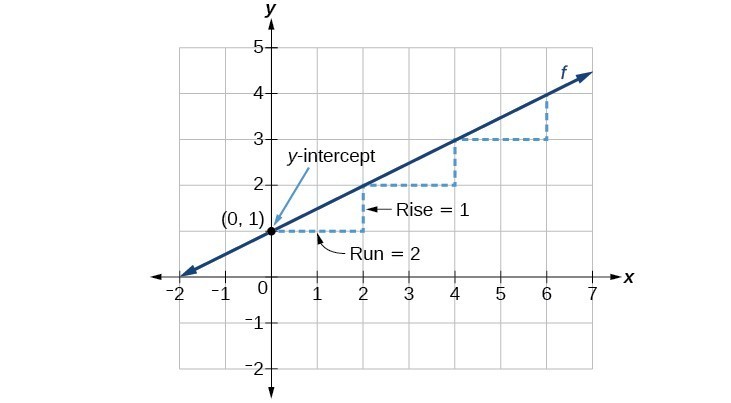
Figure 2
A General Note: Graphical Interpretation of a Linear Function
In the equation [latex]f\left(x\right)=mx+b[/latex]
- b is the y-intercept of the graph and indicates the point (0, b) at which the graph crosses the y-axis.
- m is the slope of the line and indicates the vertical displacement (rise) and horizontal displacement (run) between each successive pair of points. Recall the formula for the slope:
Q & A
Do all linear functions have y-intercepts?
Yes. All linear functions cross the y-axis and therefore have y-intercepts. (Note: A vertical line parallel to the y-axis does not have a y-intercept, but it is not a function.)
How To: Given the equation for a linear function, graph the function using the y-intercept and slope.
- Evaluate the function at an input value of zero to find the y-intercept.
- Identify the slope as the rate of change of the input value.
- Plot the point represented by the y-intercept.
- Use [latex]\frac{\text{rise}}{\text{run}}[/latex] to determine at least two more points on the line.
- Sketch the line that passes through the points.
Example 2: Graphing by Using the y-intercept and Slope
Graph [latex]f\left(x\right)=-\frac{2}{3}x+5[/latex] using the y-intercept and slope.
Try It
Find a point on the graph we drew in Example 2 that has a negative x-value.
Try It
Graphing a Linear Function Using Transformations
Another option for graphing is to use transformations of the identity function [latex]f(x)=x[/latex] . A function may be transformed by a shift up, down, left, or right. A function may also be transformed using a reflection, stretch, or compression.
Vertical Stretch or Compression
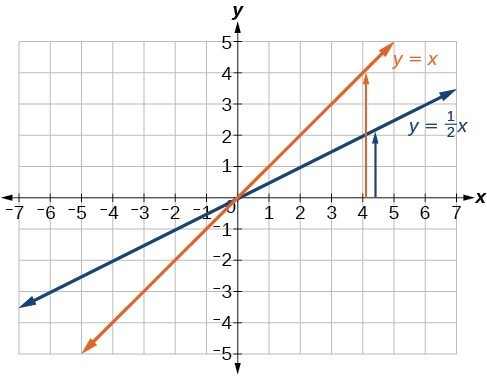
In the equation [latex]f(x)=mx[/latex], the m is acting as the vertical stretch or compression of the identity function. When m is negative, there is also a vertical reflection of the graph. Notice in Figure 4 that multiplying the equation of [latex]f(x)=x[/latex] by m stretches the graph of f by a factor of m units if m > 1 and compresses the graph of f by a factor of m units if 0 < m < 1. This means the larger the absolute value of m, the steeper the slope.
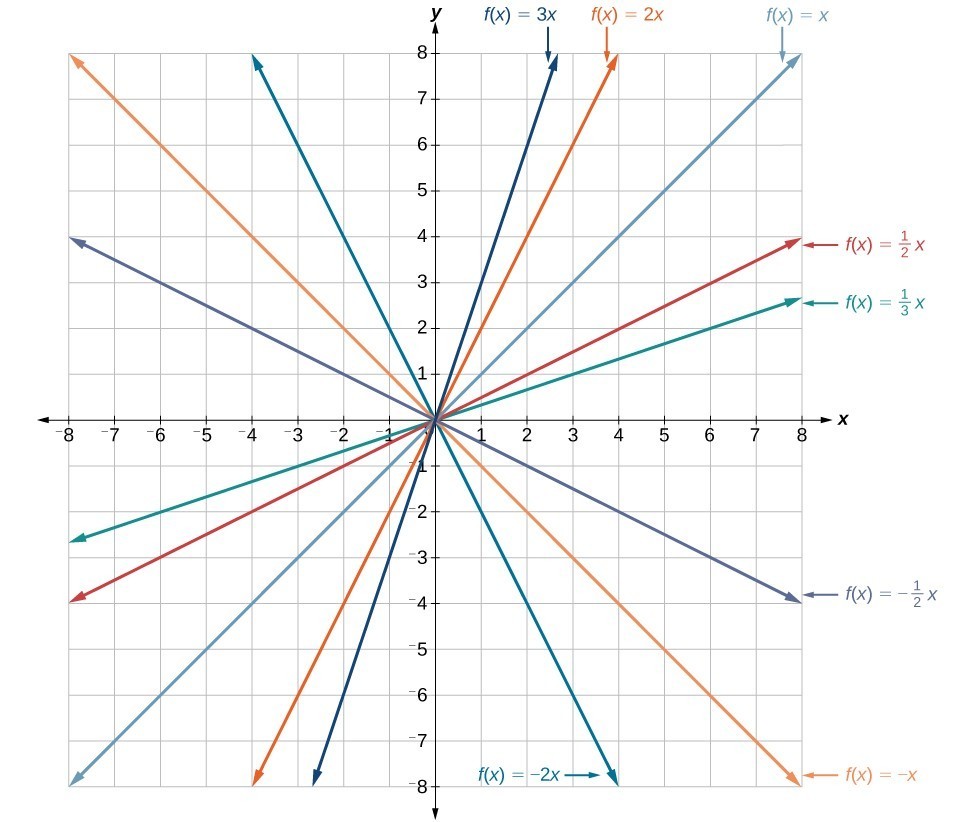
Figure 4. Vertical stretches and compressions and reflections on the function [latex]f\left(x\right)=x[/latex].
Vertical Shift
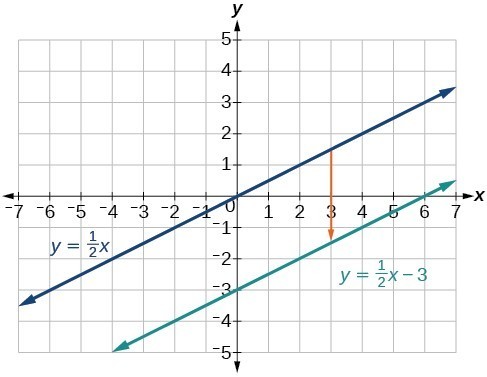
In [latex]f\left(x\right)=mx+b[/latex], the b acts as the vertical shift, moving the graph up and down without affecting the slope of the line. Notice in Figure 5 that adding a value of b to the equation of [latex]f\left(x\right)=x[/latex] shifts the graph of f a total of b units up if b is positive and |b| units down if b is negative.
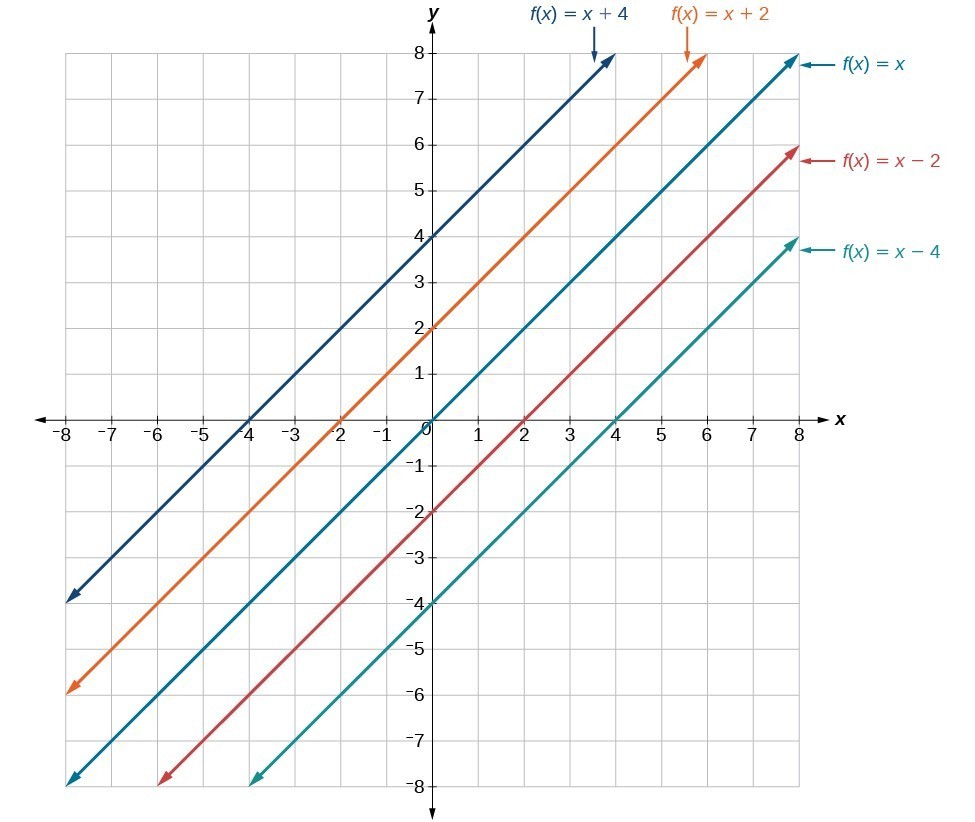
Figure 5. This graph illustrates vertical shifts of the function [latex]f(x)=x[/latex].
Using vertical stretches or compressions along with vertical shifts is another way to look at identifying different types of linear functions. Although this may not be the easiest way to graph this type of function, it is still important to practice each method.
How To: Given the equation of a linear function, use transformations to graph the linear function in the form [latex]f\left(x\right)=mx+b[/latex].
- Graph [latex]f\left(x\right)=x[/latex].
- Vertically stretch or compress the graph by a factor m.
- Shift the graph up or down b units.
Example 3: Graphing by Using Transformations
Graph [latex]f\left(x\right)=\frac{1}{2}x - 3[/latex] using transformations.
Try It
Graph [latex]f\left(x\right)=4+2x[/latex], using transformations.

Q & A
In Example 3, could we have sketched the graph by reversing the order of the transformations?
No. The order of the transformations follows the order of operations. When the function is evaluated at a given input, the corresponding output is calculated by following the order of operations. This is why we performed the compression first. For example, following the order: Let the input be 2.
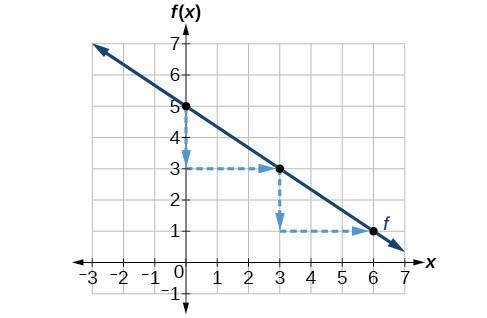
Writing the Equation for a Function from the Graph of a Line
Recall that in Linear Functions, we wrote the equation for a linear function from a graph. Now we can extend what we know about graphing linear functions to analyze graphs a little more closely. Begin by taking a look at Figure 8. We can see right away that the graph crosses the y-axis at the point (0, 4) so this is the y-intercept.
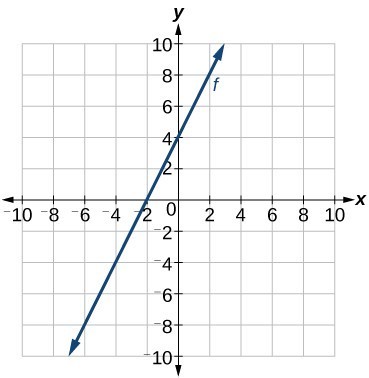
Figure 8
Then we can calculate the slope by finding the rise and run. We can choose any two points, but let’s look at the point (–2, 0). To get from this point to the y-intercept, we must move up 4 units (rise) and to the right 2 units (run). So the slope must be
Substituting the slope and y-intercept into the slope-intercept form of a line gives
How To: Given a graph of linear function, find the equation to describe the function.
- Identify the y-intercept of an equation.
- Choose two points to determine the slope.
- Substitute the y-intercept and slope into the slope-intercept form of a line.
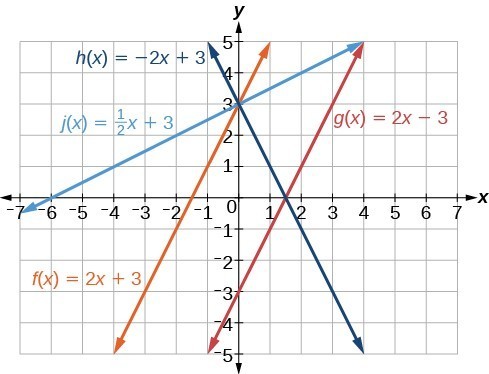
Example 4: Matching Linear Functions to Their Graphs
Match each equation of the linear functions with one of the lines in Figure 9.
- [latex]f\left(x\right)=2x+3[/latex]
- [latex]g\left(x\right)=2x - 3[/latex]
- [latex]h\left(x\right)=-2x+3[/latex]
- [latex]j\left(x\right)=\frac{1}{2}x+3[/latex]

Figure 9
Finding the x-intercept of a Line
So far, we have been finding the y-intercepts of a function: the point at which the graph of the function crosses the y-axis. A function may also have an x-intercept, which is the x-coordinate of the point where the graph of the function crosses the x-axis. In other words, it is the input value when the output value is zero.
To find the x-intercept, set a function f(x) equal to zero and solve for the value of x. For example, consider the function shown.
Set the function equal to 0 and solve for x.
The graph of the function crosses the x-axis at the point (2, 0).
Q & A
Do all linear functions have x-intercepts?
No. However, linear functions of the form y = c, where c is a nonzero real number are the only examples of linear functions with no x-intercept. For example, y = 5 is a horizontal line 5 units above the x-axis. This function has no x-intercepts.
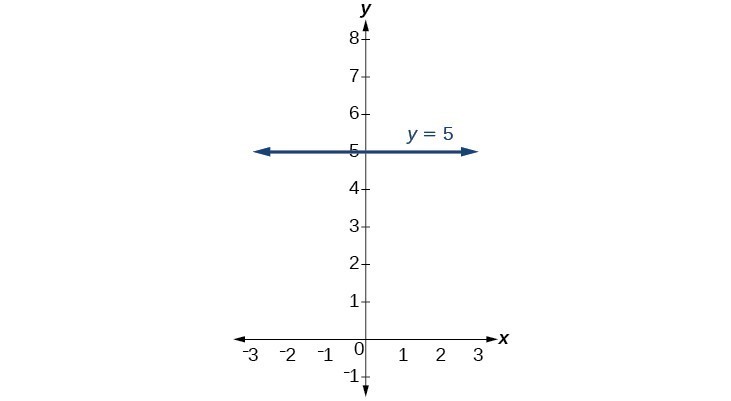
Figure 11
A General Note: x-intercept
The x-intercept of the function is the point where the graph crosses the x-axis. Points on the x-axis have the form (x,0) so we can find x-intercepts by setting f(x) = 0. For a linear function, we solve the equation mx + b = 0
Example 5: Finding an x-intercept
Find the x-intercept of [latex]f\left(x\right)=\frac{1}{2}x - 3[/latex].
Try It
Find the x-intercept of [latex]f\left(x\right)=\frac{1}{4}x - 4[/latex].
Describing Horizontal and Vertical Lines
There are two special cases of lines on a graph—horizontal and vertical lines. A horizontal line indicates a constant output, or y-value. In Figure 13, we see that the output has a value of 2 for every input value. The change in outputs between any two points, therefore, is 0. In the slope formula, the numerator is 0, so the slope is 0. If we use m = 0 in the equation [latex]f(x)=mx+b[/latex], the equation simplifies to [latex]f(x)=b[/latex]. In other words, the value of the function is a constant. This graph represents the function [latex]f(x)=2[/latex].
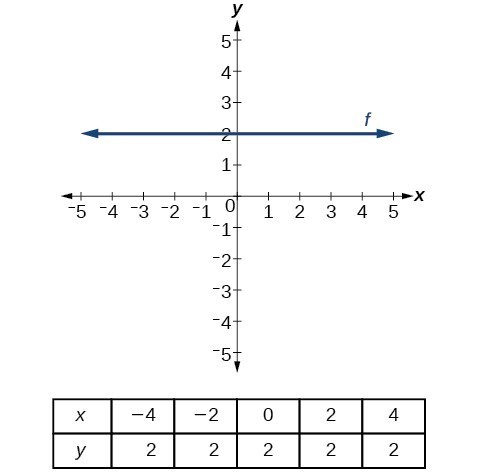
Figure 13. A horizontal line representing the function [latex]f(x)=2[/latex].
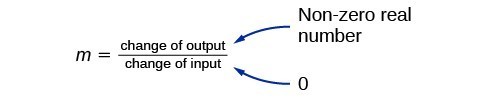
Figure 14
A vertical line indicates a constant input, or x-value. We can see that the input value for every point on the line is 2, but the output value varies. Because this input value is mapped to more than one output value, a vertical line does not represent a function. Notice that between any two points, the change in the input values is zero. In the slope formula, the denominator will be zero, so the slope of a vertical line is undefined.
Notice that a vertical line, such as the one in Figure 15, has an x-intercept, but no y-intercept unless it’s the line x = 0. This graph represents the line x = 2.
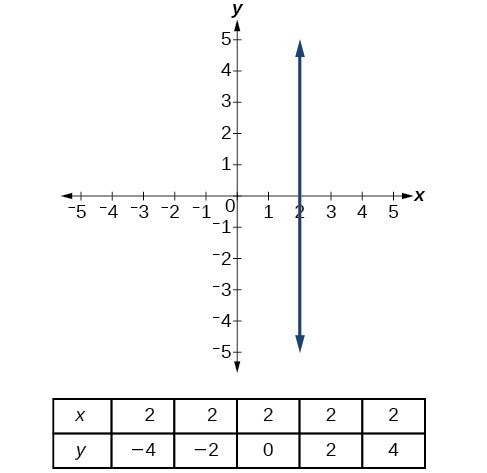
Figure 15. The vertical line, x = 2, which does not represent a function.
A General Note: Horizontal and Vertical Lines
Lines can be horizontal or vertical.
A horizontal line is a line defined by an equation in the form [latex]f(x)=b[/latex].
A vertical line is a line defined by an equation in the form [latex]x=a[/latex].
Example 6: Writing the Equation of a Horizontal Line
Write the equation of the line graphed in Figure 16.
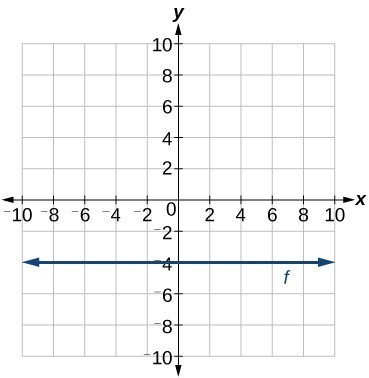
Figure 16
Example 7: Writing the Equation of a Vertical Line
Write the equation of the line graphed in Figure 17.
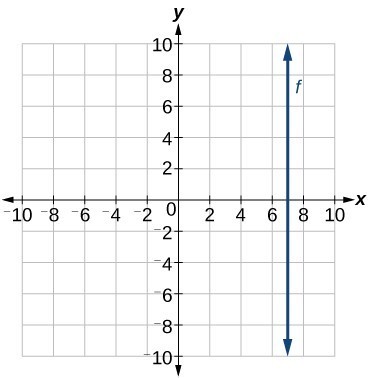
Figure 17
Determining Whether Lines are Parallel or Perpendicular
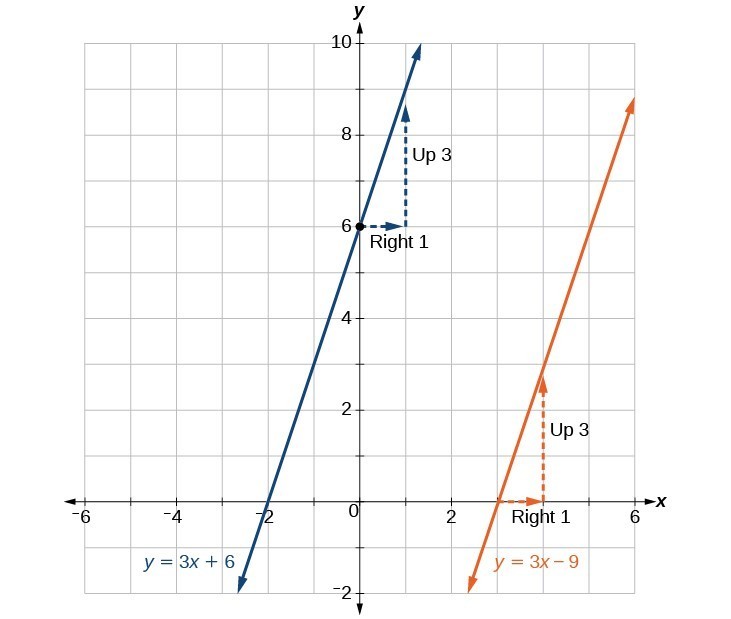
The two lines in Figure 18 are parallel lines: they will never intersect. Notice that they have exactly the same steepness, which means their slopes are identical. The only difference between the two lines is the y-intercept. If we shifted one line vertically toward the y-intercept of the other, they would become the same line.
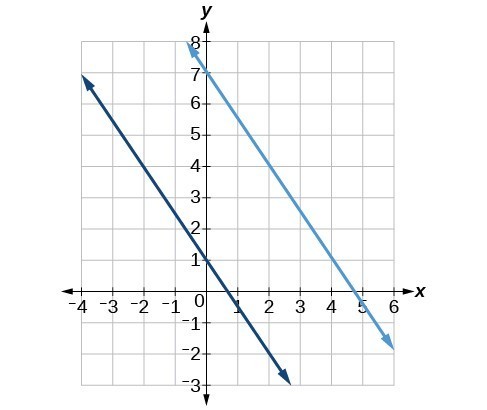
Figure 18 Parallel lines.
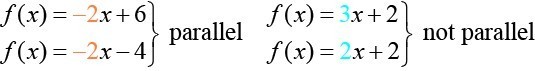
Figure 19
We can determine from their equations whether two lines are parallel by comparing their slopes. If the slopes are the same and the y-intercepts are different, the lines are parallel. If the slopes are different, the lines are not parallel.
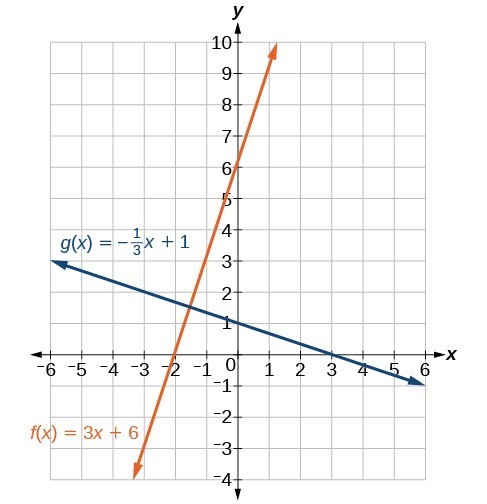
Unlike parallel lines, perpendicular lines do intersect. Their intersection forms a right, or 90-degree, angle. The two lines in Figure 20 are perpendicular.
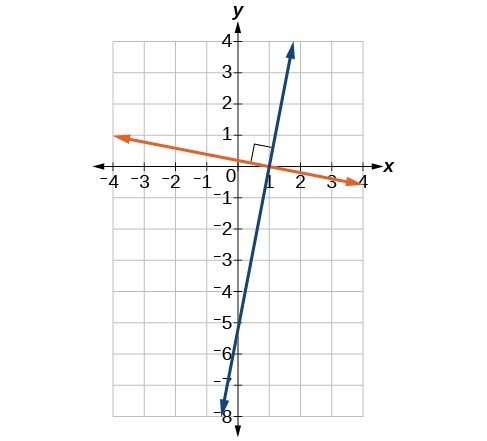
Figure 20. Perpendicular lines.
Perpendicular lines do not have the same slope. The slopes of perpendicular lines are different from one another in a specific way. The slope of one line is the negative reciprocal of the slope of the other line. The product of a number and its reciprocal is 1. So, if [latex]{m}_{1}\text{ and }{m}_{2}[/latex] are negative reciprocals of one another, they can be multiplied together to yield [latex]-1[/latex].
To find the reciprocal of a number, divide 1 by the number. So the reciprocal of 8 is [latex]\frac{1}{8}[/latex], and the reciprocal of [latex]\frac{1}{8}[/latex] is 8. To find the negative reciprocal, first find the reciprocal and then change the sign.
As with parallel lines, we can determine whether two lines are perpendicular by comparing their slopes, assuming that the lines are neither horizontal nor perpendicular. The slope of each line below is the negative reciprocal of the other so the lines are perpendicular.
The product of the slopes is –1.
A General Note: Parallel and Perpendicular Lines
Two lines are parallel lines if they do not intersect. The slopes of the lines are the same.
[latex]f\left(x\right)={m}_{1}x+{b}_{1}\text{ and }g\left(x\right)={m}_{2}x+{b}_{2}\text{ are parallel if }{m}_{1}={m}_{2}[/latex].
If and only if [latex]{b}_{1}={b}_{2}[/latex] and [latex]{m}_{1}={m}_{2}[/latex], we say the lines coincide. Coincident lines are the same line.
Two lines are perpendicular lines if they intersect at right angles.
[latex]f\left(x\right)={m}_{1}x+{b}_{1}\text{ and }g\left(x\right)={m}_{2}x+{b}_{2}\text{ are perpendicular if }{m}_{1}{m}_{2}=-1,\text{ and so }{m}_{2}=-\frac{1}{{m}_{1}}[/latex].
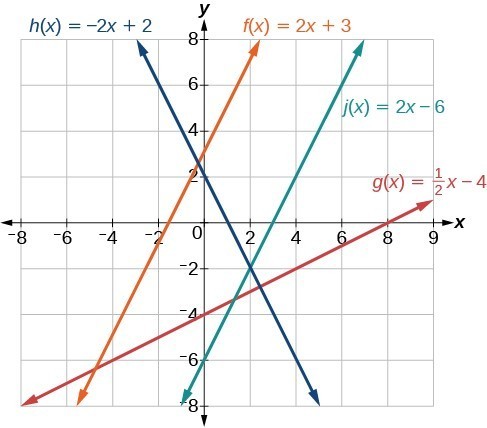
Example 8: Identifying Parallel and Perpendicular Lines
Given the functions below, identify the functions whose graphs are a pair of parallel lines and a pair of perpendicular lines.
[latex]\begin{align}&f\left(x\right)=2x+3 &&h\left(x\right)=-2x+2 \\ &g\left(x\right)=\frac{1}{2}x - 4 && j\left(x\right)=2x - 6 \end{align}[/latex]
Writing the Equation of a Line Parallel or Perpendicular to a Given Line
If we know the equation of a line, we can use what we know about slope to write the equation of a line that is either parallel or perpendicular to the given line.
Writing Equations of Parallel Lines
Suppose for example, we are given the following equation.
We know that the slope of the line formed by the function is 3. We also know that the y-intercept is (0, 1). Any other line with a slope of 3 will be parallel to f(x). So the lines formed by all of the following functions will be parallel to f(x).
Suppose then we want to write the equation of a line that is parallel to f and passes through the point (1, 7). We already know that the slope is 3. We just need to determine which value for b will give the correct line. We can begin with the point-slope form of an equation for a line, and then rewrite it in the slope-intercept form.
So [latex]g(x)=3x+4[/latex] is parallel to [latex]f(x)=3x+1[/latex] and passes through the point (1,7).
How To: Given the equation of a function and a point through which its graph passes, write the equation of a line parallel to the given line that passes through the given point.
- Find the slope of the function.
- Substitute the given values into either the general point-slope equation or the slope-intercept equation for a line.
- Simplify.
Example 9: Finding a Line Parallel to a Given Line
Find a line parallel to the graph of [latex]f\left(x\right)=3x+6[/latex] that passes through the point (3,0).
Writing Equations of Perpendicular Lines
We can use a very similar process to write the equation for a line perpendicular to a given line. Instead of using the same slope, however, we use the negative reciprocal of the given slope. Suppose we are given the following function:
The slope of the line is 2, and its negative reciprocal is [latex]-\frac{1}{2}[/latex]. Any function with a slope of [latex]-\frac{1}{2}[/latex] will be perpendicular to f(x). So the lines formed by all of the following functions will be perpendicular to f(x).
As before, we can narrow down our choices for a particular perpendicular line if we know that it passes through a given point. Suppose then we want to write the equation of a line that is perpendicular to f(x) and passes through the point (4, 0). We already know that the slope is [latex]-\frac{1}{2}[/latex]. Now we can use the point to find the y-intercept by substituting the given values into the slope-intercept form of a line and solving for b.
The equation for the function with a slope of [latex]-\frac{1}{2}[/latex] and a y-intercept of 2 is
So [latex]g\left(x\right)=-\frac{1}{2}x+2[/latex] is perpendicular to [latex]f\left(x\right)=2x+4[/latex] and passes through the point (4,0). Be aware that perpendicular lines may not look obviously perpendicular on a graphing calculator unless we use the square zoom feature.
Q & A
A horizontal line has a slope of zero and a vertical line has an undefined slope. These two lines are perpendicular, but the product of their slopes is not –1. Doesn’t this fact contradict the definition of perpendicular lines?
No. For two perpendicular linear functions, the product of their slopes is –1. However, a vertical line is not a function so the definition is not contradicted.
How To: Given the equation of a function and a point through which its graph passes, write the equation of a line perpendicular to the given line.
- Find the slope of the function.
- Determine the negative reciprocal of the slope.
- Substitute the new slope and the values for x and y from the coordinate pair provided into [latex]g\left(x\right)=mx+b[/latex].
- Solve for b.
- Write the equation for the line.
Example 10: Finding the Equation of a Perpendicular Line
Find the equation of a line perpendicular to [latex]f\left(x\right)=3x+3[/latex] that passes through the point (3,0).
Try It
Given the function [latex]h\left(x\right)=2x - 4[/latex], write an equation for the line passing through (0, 0) that is
a. parallel to h(x)
b. perpendicular to h(x)
Try It
How To: Given two points on a line and a third point, write the equation of the perpendicular line that passes through the point.
- Determine the slope of the line passing through the points.
- Find the negative reciprocal of the slope.
- Use the slope-intercept form or point-slope form to write the equation by substituting the known values.
- Simplify.
Example 11: Finding the Equation of a Line Perpendicular to a Given Line Passing through a Point
A line passes through the points (–2, 6) and (4, 5). Find the equation of a perpendicular line that passes through the point (4, 5).
Try It
A line passes through the points, (–2, –15) and (2, –3). Find the equation of a perpendicular line that passes through the point, (6, 4).
Solving a System of Linear Equations Using a Graph
A system of linear equations includes two or more linear equations. The graphs of two lines will intersect at a single point if they are not parallel. Two parallel lines can also intersect if they are coincident, which means they are the same line and they intersect at every point. For two lines that are not parallel, the single point of intersection will satisfy both equations and therefore represent the solution to the system.
To find this point when the equations are given as functions, we can solve for an input value so that [latex]f\left(x\right)=g\left(x\right)[/latex]. In other words, we can set the formulas for the lines equal to one another, and solve for the input that satisfies the equation.
Example 12: Finding a Point of Intersection Algebraically
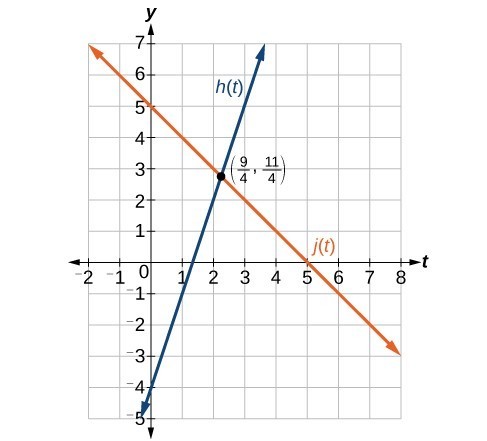
Find the point of intersection of the lines [latex]h\left(t\right)=3t - 4[/latex] and [latex]j\left(t\right)=5-t[/latex].
Q & A
If we were asked to find the point of intersection of two distinct parallel lines, should something in the solution process alert us to the fact that there are no solutions?
Yes. After setting the two equations equal to one another, the result would be the contradiction “0 = non-zero real number”.
Try It
Using the graph in the Analysis of the Solution for Example 12, identify the following for the function [latex]j\left(t\right)[/latex]:
a. y-intercept
b. x-intercept(s)
c. slope
d. Is [latex]j\left(t\right)[/latex] parallel or perpendicular to [latex]h\left(t\right)[/latex] (or neither)?
e. Is [latex]j\left(t\right)[/latex] an increasing or decreasing function (or neither)?
f. Write a transformation description for [latex]j\left(t\right)[/latex] from the identity toolkit function [latex]f\left(x\right)=x[/latex].
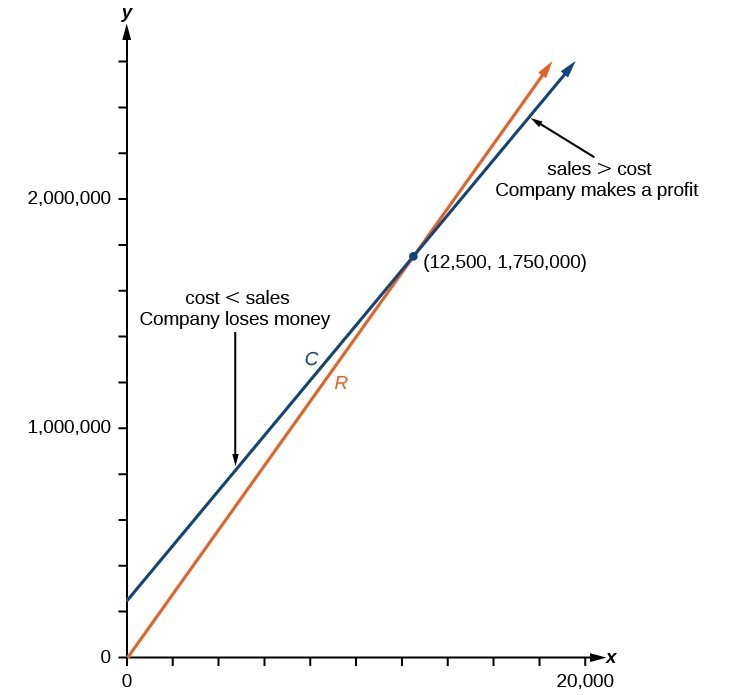
Example 13: Finding a Break-Even Point
A company sells sports helmets. The company incurs a one-time fixed cost for $250,000. Each helmet costs $120 to produce, and sells for $140.
- Find the cost function, C, to produce x helmets, in dollars.
- Find the revenue function, R, from the sales of x helmets, in dollars.
- Find the break-even point, the point of intersection of the two graphs C and R.
Key Concepts
- Linear functions may be graphed by plotting points or by using the y-intercept and slope.
- Graphs of linear functions may be transformed by using shifts up, down, left, or right, as well as through stretches, compressions, and reflections.
- The y-intercept and slope of a line may be used to write the equation of a line.
- The x-intercept is the point at which the graph of a linear function crosses the x-axis.
- Horizontal lines are written in the form, f(x) = b.
- Vertical lines are written in the form, x = b.
- Parallel lines have the same slope.
- Perpendicular lines have negative reciprocal slopes, assuming neither is vertical.
- A line parallel to another line, passing through a given point, may be found by substituting the slope value of the line and the x– and y-values of the given point into the equation, [latex]f(x)=mx+b[/latex], and using the b that results. Similarly, the point-slope form of an equation can also be used.
- A line perpendicular to another line, passing through a given point, may be found in the same manner, with the exception of using the negative reciprocal slope.
- A system of linear equations may be solved setting the two equations equal to one another and solving for x. The y-value may be found by evaluating either one of the original equations using this x-value.
- A system of linear equations may also be solved by finding the point of intersection on a graph.
Glossary
- horizontal line
- a line defined by [latex]f(x)=b[/latex], where b is a real number. The slope of a horizontal line is 0.
- parallel lines
- two or more lines with the same slope
- perpendicular lines
- two lines that intersect at right angles and have slopes that are negative reciprocals of each other
- vertical line
- a line defined by x = a, where a is a real number. The slope of a vertical line is undefined.
- x-intercept
- the point on the graph of a linear function when the output value is 0; the point at which the graph crosses the horizontal axis
Candela Citations
- Precalculus. Authored by: OpenStax College. Provided by: OpenStax. Located at: http://cnx.org/contents/fd53eae1-fa23-47c7-bb1b-972349835c3c@5.175:1/Preface. License: CC BY: Attribution
Analysis of the Solution
A graph of the function is shown in Figure 12. We can see that the x-intercept is (6, 0) as we expected.