1. Why are the sine and cosine functions called periodic functions?
2. How does the graph of [latex]y=\sin x[/latex] compare with the graph of [latex]y=\cos x[/latex]? Explain how you could horizontally translate the graph of [latex]y=\sin x[/latex] to obtain [latex]y=\cos x[/latex].
3. For the equation [latex]A\cos(Bx+C)+D[/latex], what constants affect the range of the function and how do they affect the range?
4. How does the range of a translated sine function relate to the equation [latex]y=A\sin(Bx+C)+D[/latex]?
5. How can the unit circle be used to construct the graph of [latex]f(t)=\sin t[/latex]?
6. [latex]f(x)=2\sin x[/latex]
7. [latex]f(x)=\frac{2}{3}\cos x[/latex]
8. [latex]f(x)=−3\sin x[/latex]
9. [latex]f(x)=4\sin x[/latex]
10. [latex]f(x)=2\cos x[/latex]
11. [latex]f(x)=\cos(2x)[/latex]
12. [latex]f(x)=2\sin\left(\frac{1}{2}x\right)[/latex]
13. [latex]f(x)=4\cos(\pi x)[/latex]
14. [latex]f(x)=3\cos\left(\frac{6}{5}x\right)[/latex]
15. [latex]y=3\sin(8(x+4))+5[/latex]
16. [latex]y=2\sin(3x−21)+4[/latex]
17. [latex]y=5\sin(5x+20)−2[/latex]
For the following exercises, graph one full period of each function, starting at [latex]x=0[/latex]. For each function, state the amplitude, period, and midline. State the maximum and minimum y-values and their corresponding x-values on one period for [latex]x>0[/latex]. State the phase shift and vertical translation, if applicable. Round answers to two decimal places if necessary.
18. [latex]f(t)=2\sin\left(t−\frac{5\pi}{6}\right)[/latex]
19. [latex]f(t)=−\cos\left(t+\frac{\pi}{3}\right)+1[/latex]
20. [latex]f(t)=4\cos\left(2\left(t+\frac{\pi}{4}\right)\right)−3[/latex]
21. [latex]f(t)=−\sin\left(12t+\frac{5\pi}{3}\right)[/latex]
22. [latex]f(x)=4\sin\left(\frac{\pi}{2}(x−3)\right)+7[/latex]
23. Determine the amplitude, midline, period, and an equation involving the sine function for the graph shown in Figure 26.
![A sinusoidal graph with amplitude of 2, range of [-5, -1], period of 4, and midline at y=-3.](https://s3-us-west-2.amazonaws.com/courses-images/wp-content/uploads/sites/3675/2018/09/27004008/CNX_Precalc_Figure_06_01_218.jpg)
Figure 26
24. Determine the amplitude, period, midline, and an equation involving cosine for the graph shown in Figure 27.
![A graph with a cosine parent function, with amplitude of 3, period of pi, midline at y=-1, and range of [-4,2]](https://s3-us-west-2.amazonaws.com/courses-images/wp-content/uploads/sites/3675/2018/09/27004010/CNX_Precalc_Figure_06_01_219.jpg)
Figure 27
25. Determine the amplitude, period, midline, and an equation involving cosine for the graph shown in Figure 28.
![A graph with a cosine parent function with an amplitude of 2, period of 5, midline at y=3, and a range of [1,5].](https://s3-us-west-2.amazonaws.com/courses-images/wp-content/uploads/sites/3675/2018/09/27004012/CNX_Precalc_Figure_06_01_220.jpg)
Figure 28
26. Determine the amplitude, period, midline, and an equation involving sine for the graph shown in Figure 29.
![A sinusoidal graph with amplitude of 4, period of 10, midline at y=0, and range [-4,4].](https://s3-us-west-2.amazonaws.com/courses-images/wp-content/uploads/sites/3675/2018/09/27004015/CNX_Precalc_Figure_06_01_221.jpg)
Figure 29
27. Determine the amplitude, period, midline, and an equation involving cosine for the graph shown in Figure 30.
![A graph with cosine parent function, range of function is [-4,4], amplitude of 4, period of 2.](https://s3-us-west-2.amazonaws.com/courses-images/wp-content/uploads/sites/3675/2018/09/27004017/CNX_Precalc_Figure_06_01_222.jpg)
Figure 30
28. Determine the amplitude, period, midline, and an equation involving sine for the graph shown in Figure 31.
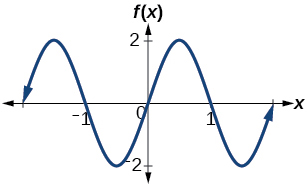
Figure 31
29. Determine the amplitude, period, midline, and an equation involving cosine for the graph shown in Figure 32.
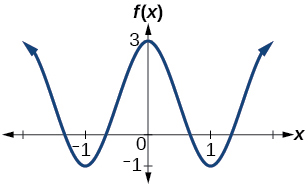
Figure 32
30. Determine the amplitude, period, midline, and an equation involving sine for the graph shown in Figure 33.
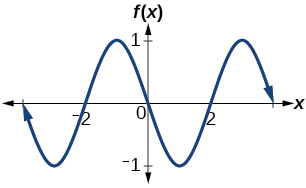
Figure 33
For the following exercises, let [latex]f(x)=\sin x[/latex].
31. On [0,2π), solve [latex]f(x)=\frac{1}{2}[/latex].
32. Evaluate [latex]f\left(\frac{\pi}{2}\right)[/latex].
33. On [0,2π), [latex]f(x)=\frac{\sqrt{2}}{2}[/latex]. Find all values of x.
34. On [0,2π), the maximum value(s) of the function occur(s) at what x-value(s)?
35. On [0,2π), the minimum value(s) of the function occur(s) at what x-value(s)?
36. Show that [latex]f(−x)=−f(x)[/latex].This means that [latex]f(x)=\sin x[/latex] is an odd function and possesses symmetry with respect to ________________.
For the following exercises, let [latex]f(x)=\cos x[/latex].
37. On [0,2π), solve the equation [latex]f(x)=\cos x=0[/latex].
38. On[0,2π), solve [latex]f(x)=\frac{1}{2}[/latex].
39. On [0,2π), find the x-intercepts of [latex]f(x)=\cos x[/latex].
40. On [0,2π), find the x-values at which the function has a maximum or minimum value.
41. On [0,2π), solve the equation [latex]f(x)=\frac{\sqrt{3}}{2}[/latex].
42. Graph [latex]h(x)=x+\sin x \text{ on}[0,2\pi][/latex]. Explain why the graph appears as it does.
43. Graph [latex]h(x)=x+\sin x[/latex] on[−100,100]. Did the graph appear as predicted in the previous exercise?
44. Graph [latex]f(x)=x\sin x[/latex] on [0,2π] and verbalize how the graph varies from the graph of [latex]f(x)=\sin x[/latex].
45. Graph [latex]f(x)=x\sin x[/latex] on the window [−10,10] and explain what the graph shows.
46. Graph [latex]f(x)=\frac{\sin x}{x}[/latex] on the window [−5π,5π] and explain what the graph shows.
47. A Ferris wheel is 25 meters in diameter and boarded from a platform that is 1 meter above the ground. The six o’clock position on the Ferris wheel is level with the loading platform. The wheel completes 1 full revolution in 10 minutes. The function h(t) gives a person’s height in meters above the ground t minutes after the wheel begins to turn.
a. Find the amplitude, midline, and period of h(t).
b. Find a formula for the height function h(t).
c. How high off the ground is a person after 5 minutes?
Candela Citations
- Precalculus. Authored by: Jay Abramson, et al.. Provided by: OpenStax. Located at: http://cnx.org/contents/fd53eae1-fa23-47c7-bb1b-972349835c3c@5.175:1/Preface. License: CC BY: Attribution. License Terms: Download for free at: http://cnx.org/contents/fd53eae1-fa23-47c7-bb1b-972349835c3c@5.175:1/Preface