1. State in your own words what it means for a function [latex]f[/latex] to be continuous at [latex]x=c[/latex].
2. State in your own words what it means for a function to be continuous on the interval [latex]\left(a,b\right)[/latex].
For the following exercises, determine why the function [latex]f[/latex] is discontinuous at a given point [latex]a[/latex] on the graph. State which condition fails.
3. [latex]f\left(x\right)=\mathrm{ln}\text{ }|\text{ }x+3\text{ }|,a=-3[/latex]
4. [latex]f\left(x\right)=\mathrm{ln}\text{ }|\text{ }5x - 2\text{ }|,a=\frac{2}{5}[/latex]
5. [latex]f\left(x\right)=\frac{{x}^{2}-16}{x+4},a=-4[/latex]
6. [latex]f\left(x\right)=\frac{{x}^{2}-16x}{x},a=0[/latex]
7. [latex]f\left(x\right)=\begin{cases}x,\hfill& x\neq 3 \\ 2x, \hfill& x=3\end{cases}a=3[/latex]
8. [latex]f\left(x\right)=\begin{cases}5, \hfill& x\neq 0 \\ 3, \hfill& x=0\end{cases} a=0[/latex]
9. [latex]f\left(x\right)=\begin{cases}\frac{1}{2-x}, \hfill& x\neq 2 \\ 3, \hfill& x=2\end{cases}a=2[/latex]
10. [latex]f\left(x\right)=\begin{cases}\frac{1}{x+6}, \hfill& x=-6 \\ x^{2}, \hfill& x\neq -6\end{cases}a=-6[/latex]
11. [latex]f\left(x\right)=\begin{cases}3+x, \hfill& x<1 \\ x, \hfill& x=1 \\ x^{2}, \hfill& x>1\end{cases}a=1[/latex]
12. [latex]f\left(x\right)=\begin{cases}3-x, \hfill& x<1 \\ x, \hfill& x=1 \\ 2x^{2}, \hfill& x>1\end{cases} a=1[/latex]
13. [latex]f\left(x\right)=\begin{cases}3+2x, \hfill& x<1 \\ x, \hfill& x=1 \\ -x^{2}, \hfill& x>1\end{cases}a=1[/latex]
14. [latex]f\left(x\right)=\begin{cases}x^{2}, \hfill& x<-2 \\ 2x+1, \hfill& x=-2 \\ x^{3}, \hfill& x>-2\end{cases}a=-2[/latex]
15. [latex]f\left(x\right)=\begin{cases}\frac{x^{2}-9}{x+3}, \hfill& x<-3 \\ x-9, \hfill& x=-3 \\ \frac{1}{x}, \hfill& x>-3\end{cases}a=-3[/latex]
16. [latex]f\left(x\right)=\begin{cases}\frac{x^{2}-9}{x+3}, \hfill& x<-3 \\ x-9, \hfill& x=-3 \\ -6, \hfill& x>-3\end{cases}a=3[/latex]
17. [latex]f\left(x\right)=\frac{{x}^{2}-4}{x - 2},\text{ }a=2[/latex]
18. [latex]f\left(x\right)=\frac{25-{x}^{2}}{{x}^{2}-10x+25},\text{ }a=5[/latex]
19. [latex]f\left(x\right)=\frac{{x}^{3}-9x}{{x}^{2}+11x+24},\text{ }a=-3[/latex]
20. [latex]f\left(x\right)=\frac{{x}^{3}-27}{{x}^{2}-3x},\text{ }a=3[/latex]
21. [latex]f\left(x\right)=\frac{x}{|x|},\text{ }a=0[/latex]
22. [latex]f\left(x\right)=\frac{2|x+2|}{x+2},\text{ }a=-2[/latex]
For the following exercises, determine whether or not the given function [latex]f[/latex] is continuous everywhere. If it is continuous everywhere it is defined, state for what range it is continuous. If it is discontinuous, state where it is discontinuous.
23. [latex]f\left(x\right)={x}^{3}-2x - 15[/latex]
24. [latex]f\left(x\right)=\frac{{x}^{2}-2x - 15}{x - 5}[/latex]
25. [latex]f\left(x\right)=2\cdot {3}^{x+4}[/latex]
26. [latex]f\left(x\right)=\mathrm{-sin}\left(3x\right)[/latex]
27. [latex]f\left(x\right)=\frac{|x - 2|}{{x}^{2}-2x}[/latex]
28. [latex]f\left(x\right)=\tan \left(x\right)+2[/latex]
29. [latex]f\left(x\right)=2x+\frac{5}{x}[/latex]
30. [latex]f\left(x\right)={\mathrm{log}}_{2}\left(x\right)[/latex]
31. [latex]f\left(x\right)=\mathrm{ln}\text{ }{x}^{2}[/latex]
32. [latex]f\left(x\right)={e}^{2x}[/latex]
33. [latex]f\left(x\right)=\sqrt{x - 4}[/latex]
34. [latex]f\left(x\right)=\sec \left(x\right)-3[/latex] .
35. [latex]f\left(x\right)={x}^{2}+\sin \left(x\right)[/latex]
36. Determine the values of [latex]b[/latex] and [latex]c[/latex] such that the following function is continuous on the entire real number line.
[latex]f\left(x\right)=\begin{cases}x+1, \hfill& {1 }<{x }<{3 }\\ x^{2}+bx+c, \hfill& |x-2|\geq 1\end{cases}[/latex]
For the following exercises, refer to Figure 15. Each square represents one square unit. For each value of [latex]a[/latex], determine which of the three conditions of continuity are satisfied at [latex]x=a[/latex] and which are not.
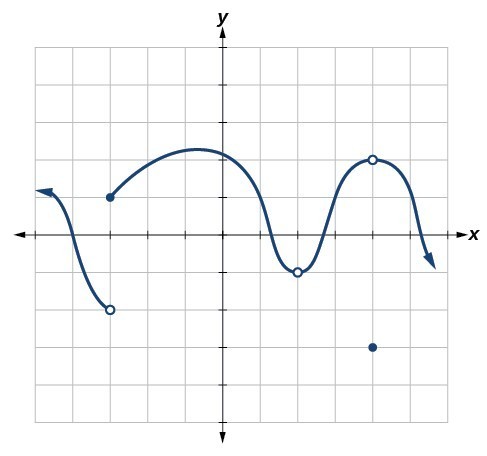
Figure 15
37. [latex]x=-3[/latex]
38. [latex]x=2[/latex]
39. [latex]x=4[/latex]
For the following exercises, use a graphing utility to graph the function [latex]f\left(x\right)=\sin \left(\frac{12\pi }{x}\right)[/latex] as in Figure 16. Set the x-axis a short distance before and after 0 to illustrate the point of discontinuity.
![Graph of the sinusodial function with a viewing window of [-10, 10] by [-1, 1].](https://s3-us-west-2.amazonaws.com/courses-images/wp-content/uploads/sites/3675/2018/09/27185344/CNX_Precalc_Figure_12_03_202F.jpg)
Figure 16
40. Which conditions for continuity fail at the point of discontinuity?
41. Evaluate [latex]f\left(0\right)[/latex].
42. Solve for [latex]x[/latex] if [latex]f\left(x\right)=0[/latex].
43. What is the domain of [latex]f\left(x\right)?[/latex]
For the following exercises, consider the function shown in Figure 17.
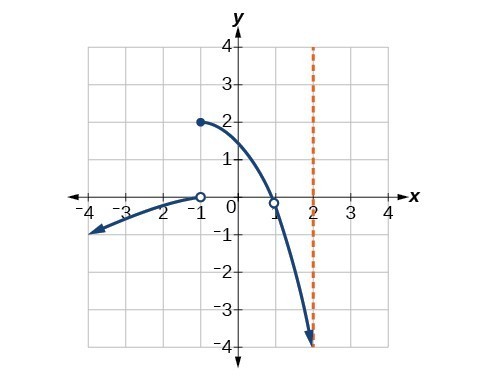
Figure 17
44. At what x-coordinates is the function discontinuous?
45. What condition of continuity is violated at these points?
46. Consider the function shown in Figure 18. At what x-coordinates is the function discontinuous? What condition(s) of continuity were violated?
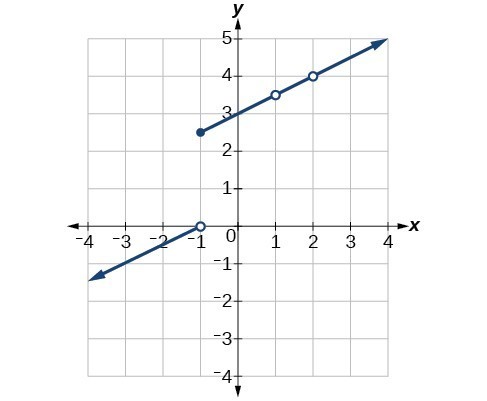
Figure 18
47. Construct a function that passes through the origin with a constant slope of 1, with removable discontinuities at [latex]x=-7[/latex] and [latex]x=1[/latex].
48. The function [latex]f\left(x\right)=\frac{{x}^{3}-1}{x - 1}[/latex] is graphed in Figure 19. It appears to be continuous on the interval [latex]\left[-3,3\right][/latex], but there is an x-value on that interval at which the function is discontinuous. Determine the value of [latex]x[/latex] at which the function is discontinuous, and explain the pitfall of utilizing technology when considering continuity of a function by examining its graph.
Figure 19
49. Find the limit [latex]\underset{x\to 1}{\mathrm{lim}}f\left(x\right)[/latex] and determine if the following function is continuous at [latex]x=1:[/latex]
50. The function is discontinuous at [latex]x=1[/latex] because the limit as [latex]x[/latex] approaches 1 is 5 and [latex]f\left(1\right)=2[/latex].
51. The graph of [latex]f\left(x\right)=\frac{\sin \left(2x\right)}{x}[/latex] is shown in Figure 20. Is the function [latex]f\left(x\right)[/latex] continuous at [latex]x=0?[/latex] Why or why not?
![Graph of the function f(x) = sin(2x)/x with a viewing window of [-4.5, 4.5] by [-1, 2.5]](https://s3-us-west-2.amazonaws.com/courses-images/wp-content/uploads/sites/3675/2018/09/27185352/CNX_Precalc_Figure_12_03_206.jpg)
Figure 20
Candela Citations
- Precalculus. Authored by: Jay Abramson, et al.. Provided by: OpenStax. Located at: http://cnx.org/contents/fd53eae1-fa23-47c7-bb1b-972349835c3c@5.175:1/Preface. License: CC BY: Attribution. License Terms: Download for free at: http://cnx.org/contents/fd53eae1-fa23-47c7-bb1b-972349835c3c@5.175:1/Preface