section 2.3 Learning Objectives
2.3: Describing Sets as Intersections or Unions
- Find the intersection and union of two sets of numbers
- Use interval notation to describe sets of numbers as intersections and unions
- Recognize when an intersection has no solution or when a union has all real numbers as the solution
Introduction to Sets
A set is a collection of objects which are called elements. The elements are distinct and, thus, are listed only once. One way to identify a set is by the List or Roster Method, whereby the elements are listed within braces { }.
For example, consider the set of whole number less than 8. Using the List (Roster) Method, we would write this set as
[latex]\{0,1,2,3,4,5,6,7\}[/latex]
It is worth noting that with the List Method, the elements in the set have no inherent order. So, for example, [latex]\{4,6,0,2,1,7,3,5\}[/latex] would denote the same set.
To indicate that an object is an element of a set, the symbol [latex]\in[/latex] is used. To indicate that an object is not an element of a set, the symbol [latex]\notin[/latex] is used. Hence, in our above example, we could write [latex]5 \in\{0,1,2,3,4,5,6,7\}[/latex], whereas [latex]8 \notin\{0,1,2,3,4,5,6,7\}[/latex].
Example 1
Write the first four months of a year as set M using the List Method, identify one of the months as an element of the set, and identify a month that is not an element of the set.
A set that has no elements is called an empty set and is denoted by the symbol Ø.
Find the intersection and union of sets
Sets can be joined together using the intersection of sets or the union of sets.
The intersection of two sets A and B is the set of all elements that are common to both A and B and is denoted as A ∩ B.
The union of two sets A and B is the set of all elements in A or B and is denoted as A ∪ B
Example 2
Find the intersection: {2, 3, 4, 5, 6, 7} ∩ {1, 2, 5, 7, 8, 9}
Example 3
Find the union: {2, 4, 6, 8} ∪ {2, 3, 5, 7}
Use interval notation to describe sets of numbers as intersections and unions
When two inequalities are joined by the word and, the solution of the compound inequality occurs when both inequalities are true at the same time. It is the overlap, or intersection, of the solutions for each inequality. When the two inequalities are joined by the word or, the solution of the compound inequality occurs when either of the inequalities is true. The solution is the combination, or union, of the two individual solutions.
In this module we will learn how to solve compound inequalities that are joined with the words AND and OR. First, it will help to see some examples of inequalities, intervals, and graphs of compound inequalities. This will help you describe the solutions to compound inequalities properly.
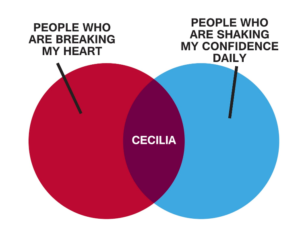
Venn diagrams use the concept of intersections and unions to show how much two or more things share in common. For example, this Venn diagram shows the intersection of people who are breaking your heart and those who are shaking your confidence daily. Apparently Cecilia has both of these qualities; therefore she is the intersection of the two.
In mathematical terms, consider the inequality [latex]x\lt6[/latex] and [latex]x\gt2[/latex]. How would we interpret what numbers x can be, and what would the interval look like?
In words, x must be less than 6 and at the same time, it must be greater than 2, much like the Venn diagram above, where Cecilia is at once breaking your heart and shaking your confidence daily. Let’s look at a graph to see what numbers are possible with these constraints.
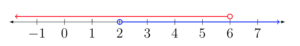
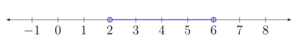
The numbers that are shared by both lines on the graph are called the intersection of the two inequalities [latex]x\lt6[/latex] and [latex]x\gt2[/latex]. This is called a bounded inequality and is written as [latex]2\lt{x}\lt6[/latex]. Think about that one for a minute. x must be less than 6 and greater than two—the values for x will fall between two numbers. In interval notation, this looks like [latex]\left(2,6\right)[/latex]. The graph would look like this:
On the other hand, if you need to represent two things that don’t share any common elements or traits, you can use a union. The following Venn diagram shows two things that share no similar traits or elements but are often considered in the same application, such as online shopping or banking.

In mathematical terms, for example, [latex]x>6[/latex] or [latex]x<2[/latex] is an inequality joined by the word “or”. Using interval notation, we can describe each of these inequalities separately:
[latex]x\gt6[/latex] is the same as [latex]\left(6, \infty\right)[/latex] and [latex]x<2[/latex] is the same as [latex]\left(-\infty, 2\right)[/latex]. If we are describing solutions to inequalities, what effect does the or have? We are saying that solutions are either real numbers less than two or real numbers greater than 6. Can you see why we need to write them as two separate intervals? Let’s look at a graph to get a clear picture of what is going on.
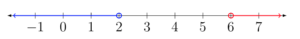
When you place both of these inequalities on a graph, we can see that they share no numbers in common. This is what we call a union, as mentioned above. The interval notation associated with a union is a big U, so instead of writing or, we join our intervals with a big U, like this:
[latex]\left(-\infty, 2\right)\cup\left(6, \infty\right)[/latex]
Example 4
Draw the graph of the compound inequality [latex]x\gt3[/latex] or [latex]x\le4[/latex] and describe the set of x-values that will satisfy it with an interval.


In the following video you will see two examples of how to express inequalities involving OR graphically and as an interval.
Example 5
Draw a graph of the compound inequality: [latex]x\lt5[/latex] and [latex]x\ge−1[/latex], and describe the set of x-values that will satisfy it with an interval.


Example 6
Considering the compound inequality [latex]x\lt{-3}[/latex] and [latex]x\gt{3}[/latex], describe the set of x-values that will satisfy it with an interval.

The following video presents two examples of how to draw inequalities involving AND, as well as write the corresponding intervals.
Candela Citations
- Cecilia Venn Diagram Image. Authored by: Lumen Learning. License: CC BY: Attribution
- Internet Privacy Venn Diagram. Authored by: Lumen Learning. License: CC BY: Attribution
- Revision and Adaptation. License: CC BY: Attribution
- Intro to Sets. Authored by: Carla Kulinsky. Provided by: Salt Lake Community College . License: CC BY: Attribution