Why and how do we use the graphs of linear equations?
Much as the road sign at the right can help you quickly understand a “falling rocks” hazard ahead, graphs are a useful way of conveying information visually. Graphs of linear equations are especially effective for representing relationships between things that change at a constant rate, and they often do a better job than words or mathematical equations alone.
Suppose your manager has asked you to create and present a financial report at the next company meeting. She wants to know how the amount of revenue your team brought to the company changed during the last year. Your job is to get the information and choose the best method for communicating it.
You start with a table showing the initial monthly revenue and the revenue earned in the odd numbered months:
| Month | Revenue |
|---|---|
| 0 | 1000 |
| 1 | 1250 |
| 3 | 1750 |
| 5 | 2250 |
| 7 | 2750 |
| 9 | 3250 |
| 11 | 3750 |
The table is nicely organized, and its values are very precise, but it doesn’t readily show how the values change over time. So you study the numbers and try to describe this change in words:
Our team started the year with $1000 per month in revenue. For each additional month in the year 2015, our team produced an increase in $250 of revenue.
Next, you try expressing the information as a linear equation: [latex]y=250x+1000[/latex]
Again, both are very accurate, but neither reading two sentences out loud nor putting an equation on a poster board will go over very well with your manager or team members. You haven’t given them a way to picture the information. So, you try graphing the equation, which gives you the following:
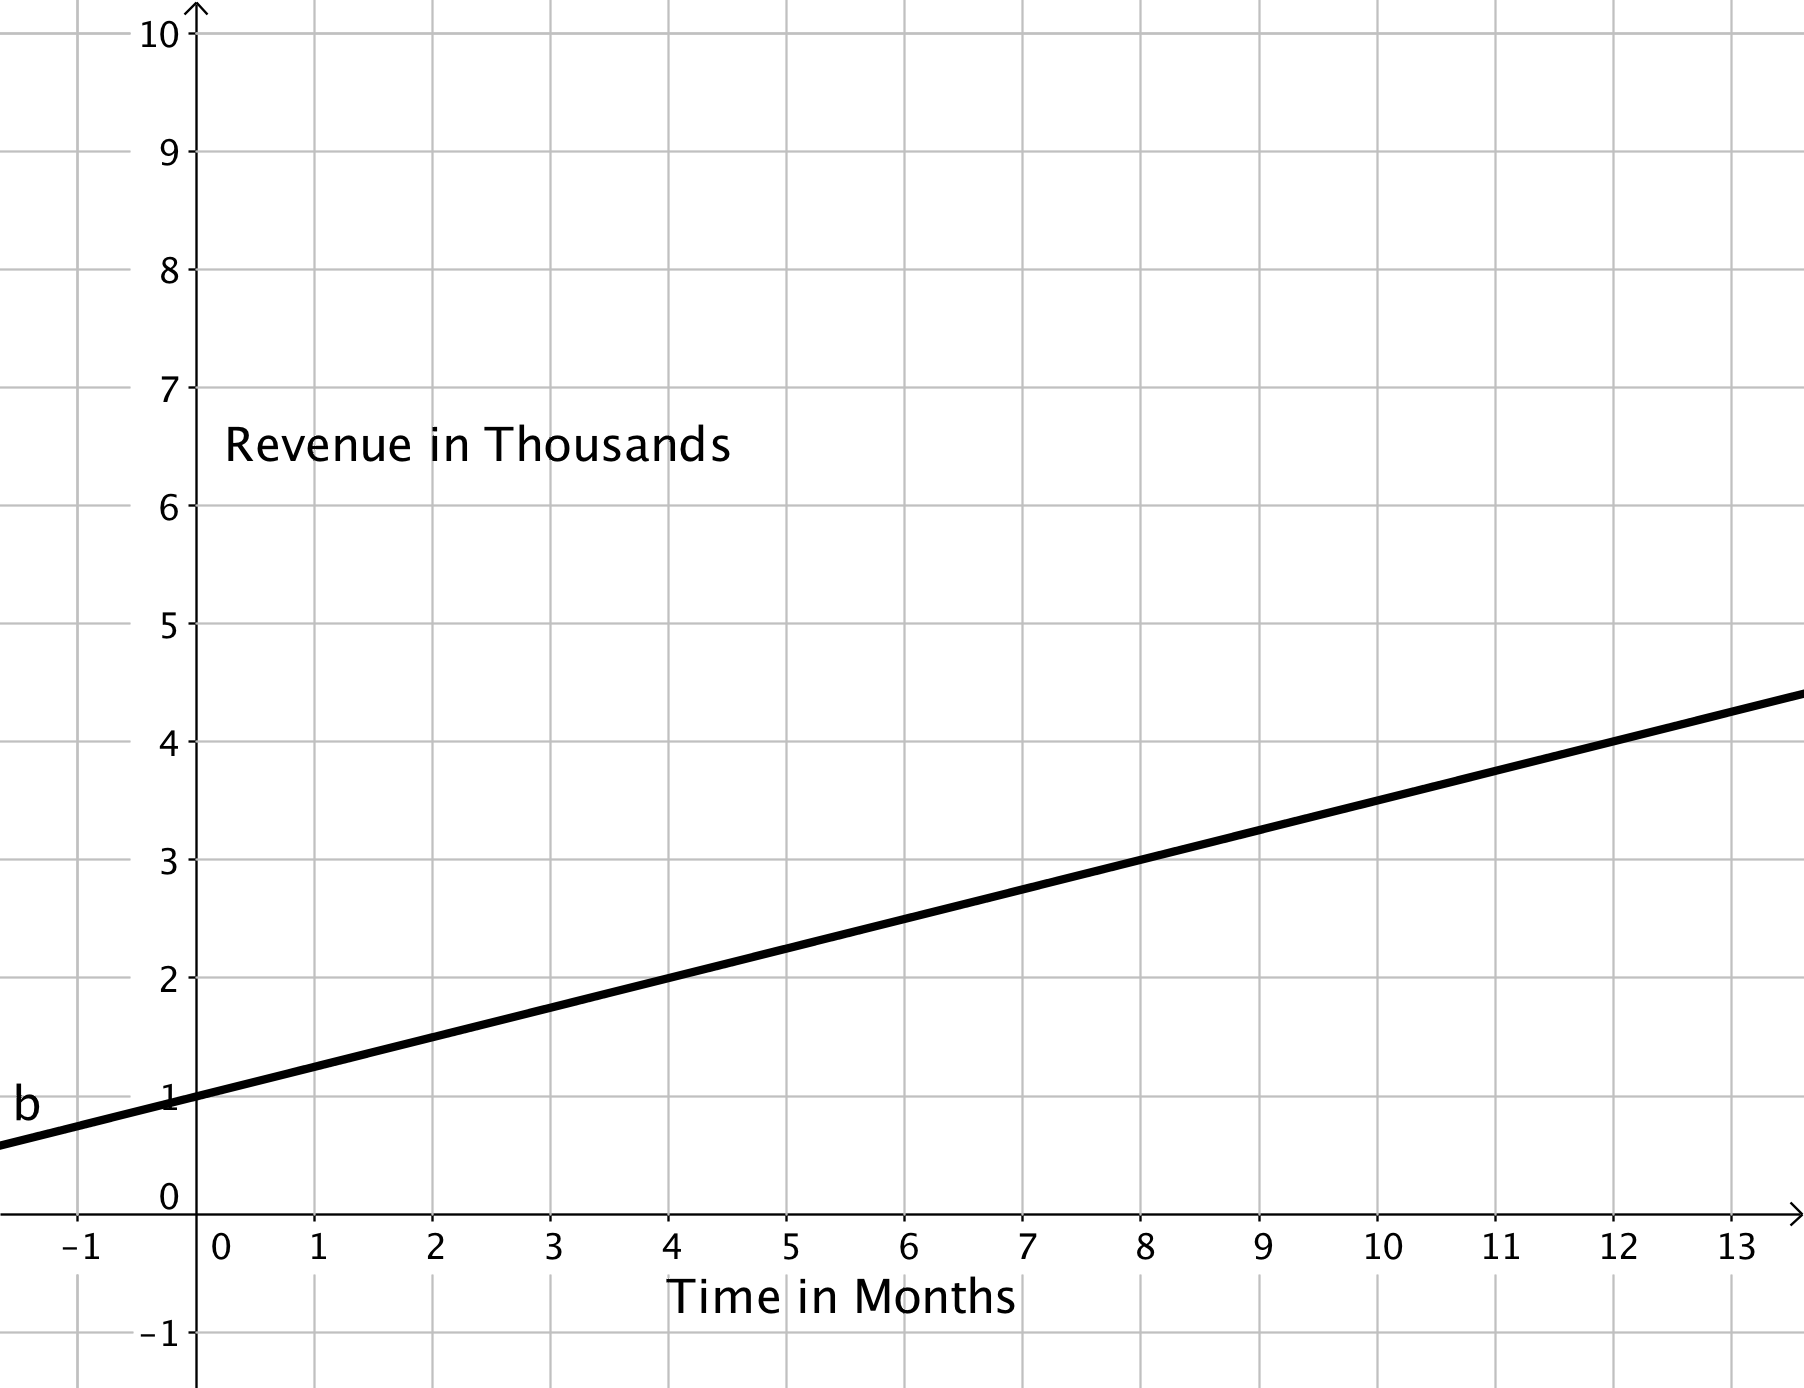
Graph showing the linear relationship between time and the change in revenue.
All four—the table, the words, the equation, and the graph—are representations of the same thing. And, depending on your purpose, one representation may get your point across more clearly than another. As you can see, graphs are especially good at conveying information about the relationship between things (in this case, time and revenue) with very little explanation. Your graph shows that the revenue your team produced during the last year steadily increased—a very encouraging trend! You decide that the graph is definitely what you’ll present at the meeting.
In this module, you’ll learn how to create linear graphs in the Cartesian coordinate plane (like the one above) and why graphs are an especially useful means of conveying information.
Module 3 Learning Objectives
3.1: Cartesian Coordinate Plane and Ordered Pairs
- Given a point in the coordinate plane, determine the ordered pair that describes the point
- Plot points in the coordinate plane
- Given an ordered pair, identify in which quadrant of the coordinate plane it is located
3.2: Introduction to Functions
- Determine if a relation is a function
- Identify the domain and range of a set of ordered pairs
- Evaluate a function written in function notation
- Find the domain of a rational function
3.3: Graphing Linear Functions
- Identify if an ordered pair is a solution to a linear equation
- Graph a linear equation by plotting points
- Identify the x-intercept and y-intercept of a linear equation
- Use the intercepts to graph a linear equation
- Graph horizontal and vertical lines
3.4: Slope of a Line
- Identify the slope of a line from the graph
- Find the slope of a line given two points on a line
- Find the slope and y-intercept given the equation of a line
- Find the slope of horizontal and vertical lines
- Find the slopes of parallel and perpendicular lines
- Graph a line using the slope and y-intercept
3.5: Applications of Slope
- Find the average rate of change
- Use a linear equation to make a prediction
3.6: Graphing Linear Inequalities
- Determine if an ordered pair satisfies a linear inequality
- Graph horizontal and vertical inequalities
- Graph a linear inequality in two variables
3.7: Writing Linear Equations
- Write the equation of the line given the slope and the y-intercept using the slope-intercept form
- Write the equation of the line given the slope and a point on the line using the point-slope form
- Write the equation of the line given two points on the line
- Write the equation of a horizontal or vertical line when given the graph
- Write the equation of a line given a point and a parallel or perpendicular line