Learning Outcomes
- Find the vertex, axis of symmetry, [latex]y[/latex]-intercept, and/or minimum or maximum value of a quadratic function in the vertex form [latex]f(x)=a{(x-h)}^{2}+k[/latex].
- Graph quadratic functions in vertex form.

Figure 1. An array of satellite dishes. (credit: Matthew Colvin de Valle, Flickr)
Curved antennas, such as the ones shown in the photo, are commonly used to focus microwaves and radio waves to transmit television and telephone signals, as well as satellite and spacecraft communication. The cross-section of the antenna is in the shape of a parabola, which can be described by a quadratic function.
Quadratic Functions
Below are three forms of the same quadratic function.
Vertex Form: [latex]f(x)=-2(x-3)^2+2[/latex]
Intercept Form: [latex]f(x)=-2(x-2)(x-4)[/latex]
General Form: [latex]f(x)=-2x^2+12x-16[/latex]
What do all of these functions have in common? What makes all of the above functions QUADRATIC functions? A Quadratic Function is a polynomial function of degree [latex]2[/latex]. The verb quadrare in Latin means “to make square.” The quadratic term [latex]-2x^2[/latex] can be read “negative two multiplied by [latex]x[/latex] to the second power” or more simply, “negative two [latex]x[/latex] squared.” The graph of a quadratic function is a curve called a parabola.
| Quadratic Functions | Non-Quadratic Functions |
| [latex]f(x)=x^2[/latex] | [latex]y=3x+2[/latex] |
| [latex]y=5x-4x^2-1[/latex] | [latex]f(x)=x^4-3x^3+5x^2-4x+1[/latex] |
| [latex]g(x)=4(x+1)(x-3)[/latex] | [latex]y=|x^2-4|[/latex] |
| [latex]y=-(x+4)^2-5[/latex] | [latex]g(x)=x^3-9[/latex] |
Recognize characteristics of parabolas
The graph of a quadratic function is a U-shaped curve called a parabola. In this section, we will learn how to graph parabolas. One important feature of the graph is that it has an extreme point, called the vertex. If the parabola opens upward, the vertex represents the lowest point on the graph, or the minimum value of the quadratic function. If the parabola opens downward, the vertex represents the highest point on the graph, or the maximum value. In either case, the vertex is the turning point on the graph. The graph of a parabola is symmetric with respect to a vertical line drawn through the vertex, called the axis of symmetry. These features are illustrated in Figure 2.
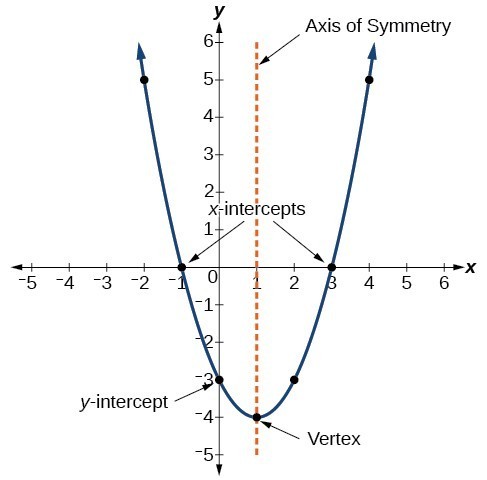
Figure 2
The [latex]y[/latex]-intercept is the point at which the parabola crosses the [latex]y[/latex]-axis, the value of [latex]y[/latex] at which [latex]x = 0[/latex]; [latex]( 0,\text{__} )[/latex]. The [latex]x[/latex]-intercept(s) are the point(s) at which the parabola touches or crosses the [latex]x[/latex]-axis. If they exist, the [latex]x[/latex]-intercepts represent the zeros, or roots, of the quadratic function, the values of [latex]x[/latex] at which [latex]y= 0[/latex]; [latex]( \text{__}, 0)[/latex]. The intercepts are illustrated in Figure 2.
Example
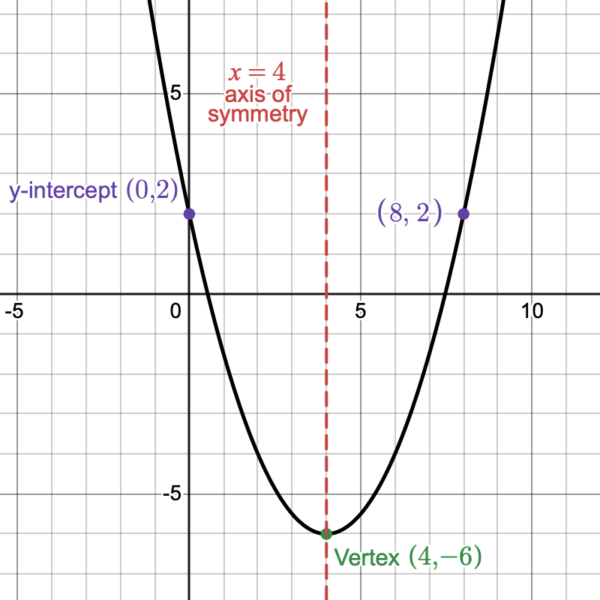
Determine the vertex, axis of symmetry, [latex]x[/latex]-intercepts (if any), and [latex]y[/latex]-intercept of the parabola shown in Figure 3.

Figure 3

Figure 4
Understand how the graph of a parabola is related to its quadratic function
The vertex form of a quadratic function presents in the form
[latex]f\left(x\right)=a{\left(x-h\right)}^{2}+k[/latex]
where [latex]\left(h,\text{ }k\right)[/latex] is the vertex.
How do the [latex]a[/latex], [latex]h[/latex], and [latex]k[/latex] change the parabola?
Try It
Click on “Desmos” in the lower right corner of the graph below. That will open the graph in a new tab where you can explore the ways the [latex]a[/latex], [latex]h[/latex], and [latex]k[/latex] change the graph. Use the sliders on the left side to change the look of the parabola. As you move each slider, notice how it is changing the graph from the original graph of [latex]y=x^2[/latex].
- How is the [latex]a[/latex] changing the graph? (Hint: explore what happens when [latex]a[/latex] is negative, when [latex]a[/latex] is more than 0 but less than 1, and when [latex]a[/latex] is positive.)
- How is the [latex]h[/latex] changing the graph? (Make sure to move the sliders in both positive and negative directions.)
- How is the [latex]k[/latex] changing the graph? (Make sure to move the sliders in both positive and negative directions.)
Graphing Quadratic Functions of the form [latex]f(x)={x}^{2}+k[/latex]
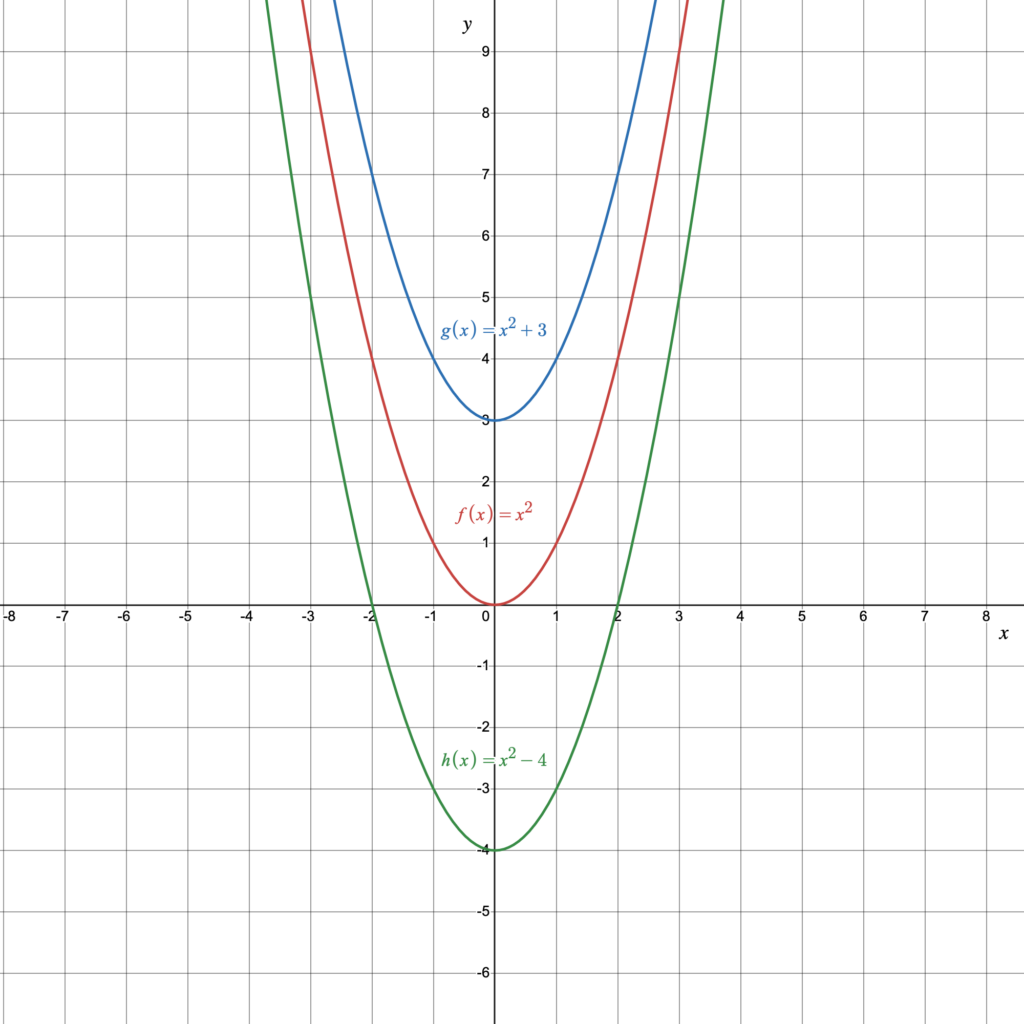
Let’s begin by looking at the graph of quadratic functions of the form [latex]f(x)={x}^{2}+k[/latex] such as the functions [latex]\require{color}\color{MidnightBlue}{g(x)=x^2+3}[/latex] and [latex]\color{ForestGreen}{h(x)=x^2-4}[/latex]. We will compare these two functions to the parent function [latex]\color{BrickRed}{f(x)=x^2}[/latex].
The vertical shift of the graph depends on the value of [latex]k[/latex] in the function [latex]f(x)=x^2+k[/latex]. When [latex]k[/latex] is positive, the graph is shifted up [latex]k[/latex] units. When [latex]k[/latex] is negative, the graph is shifted down [latex]|k|[/latex] units. Notice in Figure 5 that the graph of [latex]\color{MidnightBlue}{g(x)=x^2+3}[/latex] is identical to the graph of [latex]\color{BrickRed}{f}[/latex] except that it is shifted vertically up 3 units and that the graph of [latex]\color{ForestGreen}{h(x)=x^2-4}[/latex] is identical to the graph of [latex]\color{BrickRed}{f}[/latex] except that it is shifted vertically down 4 units.
Graphing Quadratic Functions of the form [latex]f(x)=(x-h)^2[/latex]
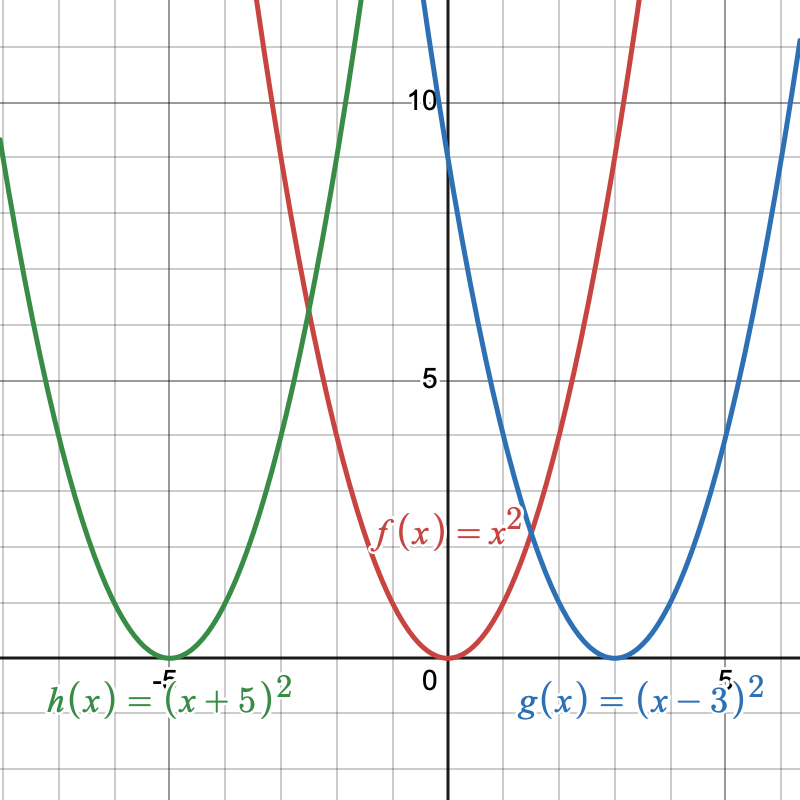
We now will look at the graph of quadratic functions of the form [latex]f(x)=(x-h)^2[/latex]. Our goal is to determine the effect adding or subtracting a real number, [latex]h[/latex] from [latex]x[/latex], has on the parent function [latex]f(x)=x^2[/latex]. Let’s look at the functions [latex]\color{MidnightBlue}{g(x)=(x-3)^2}[/latex] and [latex]\color{forestGreen}{h(x)=(x+5)^2}[/latex]. We will compare these two functions to the parent function [latex]\color{BrickRed}{f(x)=x^2}[/latex].
The horizontal shift of the graph depends on the value of [latex]h[/latex] in the function [latex]f(x)=(x-h)^2[/latex]. When [latex]h[/latex] is subtracted from [latex]x[/latex], the graph is shifted right [latex]h[/latex] units. When [latex]h[/latex] is added to [latex]x[/latex], the graph is shifted left [latex]h[/latex] units. Notice in Figure 6 that the graph of [latex]\color{MidnightBlue}{g(x)=(x-3)^2}[/latex] is identical to the graph of [latex]\color{BrickRed}{f}[/latex] except that it is shifted horizontally right [latex]3[/latex] units and that the graph of [latex]\color{forestGreen}{h(x)=(x+5)^2}[/latex] is identical to the graph of [latex]\color{BrickRed}{f}[/latex] except that it is shifted horizontally left [latex]5[/latex] units.
Combining Horizontal and Vertical Shifts
Let’s now look at combining horizontal and vertical shifts that are of the form [latex]f(x)=(x-h)^2+k[/latex].
ExAMPLE
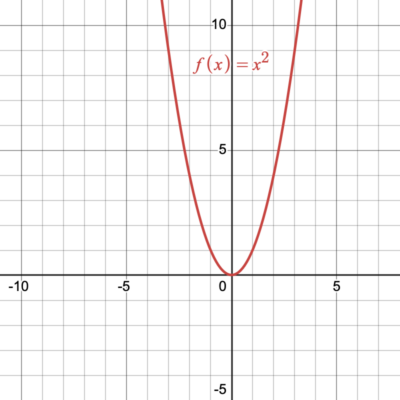
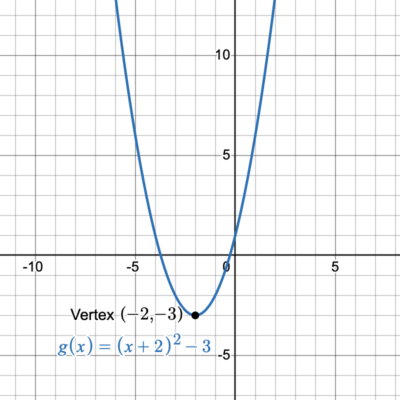
Graph the function [latex]g(x)={(x+2)}^{2}-3[/latex] using transformations and label the vertex.
Graphing Quadratic Functions of the form [latex]f(x)=a{x}^{2}[/latex]
We now will look at the graph of quadratic functions of the form [latex]f(x)=a{x}^{2}[/latex]. Our goal is to determine the effect that multiplying by a non-zero real number, [latex]a[/latex] has on the parent function [latex]f(x)=x^2[/latex]. Let’s look at the functions [latex]\color{MidnightBlue}{g(x)=2{x}^{2}}[/latex] and [latex]\color{forestGreen}{h(x)=\dfrac{1}{2}{x}^{2}}[/latex]. We will compare these two functions to the parent function [latex]\color{BrickRed}{f(x)=x^2}[/latex]. Does multiplying by [latex]2[/latex] or [latex]\dfrac{1}{2}[/latex] cause the vertex to move to a different location? Does multiplying by [latex]2[/latex] or [latex]\dfrac{1}{2}[/latex] change the shape of the parabola?
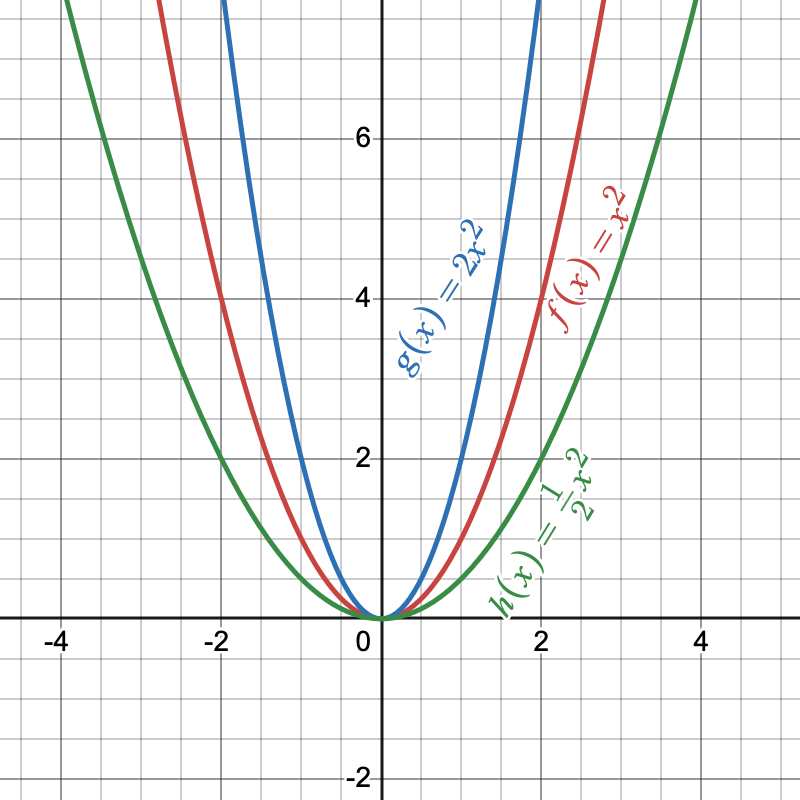
Figure 7
In Figure 7, we can see that the vertex remained in the same place, at [latex](0,0)[/latex], but the shape of the parabola changed. The graph of [latex]\color{MidnightBlue}{g(x)=2{x}^{2}}[/latex] is the same as the [latex]\color{BrickRed}{f}[/latex] function but stretched vertically by a factor of [latex]2[/latex] (the blue graph appears narrower than [latex]\color{BrickRed}{f(x)=x^2}[/latex]). As [latex]a[/latex] gets larger, the parabola gets narrower, or vertically stretched. What happens to the graph when [latex]a[/latex] is between zero and one ([latex]0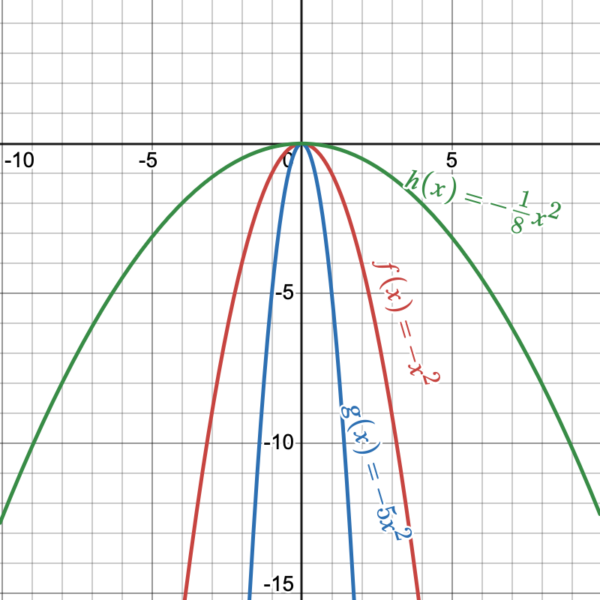
Figure 8
The magnitude of [latex]a[/latex] indicates the stretch of the graph. If [latex]|a|>1[/latex], there is a vertical stretch and the graph appears to become narrower. If [latex]|a|<1[/latex], there is a vertical compression and the graph appears to become wider. In Figure 8, we notice that when [latex]a<0[/latex], is reflected across the [latex]x[/latex]-axis, the parabola opens downward The vertex at [latex](0,0)[/latex] is the highest point on the graph and [latex]k=0[/latex] is the maximum value of this quadratic function. The graph of [latex]\color{MidnightBlue}{g(x)=-5x^2}[/latex] is the same as the graph [latex]\color{BrickRed}{f(x)=-x^2}[/latex] with a vertical stretch by a factor of [latex]|-5|[/latex] (the blue graph appears narrower than [latex]\color{BrickRed}{f(x)=-x^2}[/latex]). The graph of [latex]\color{ForestGreen}{h(x)=-\dfrac{1}{8}x^2}[/latex] is the same as the graph [latex]\color{BrickRed}{f(x)=-x^2}[/latex] but compressed vertically by a factor of [latex]|-\dfrac{1}{8}|[/latex] (the green graph appears wider than [latex]\color{BrickRed}{f(x)=-x^2}[/latex]).
Graphing Quadratic Functions of the form [latex]f(x)=a(x-h)^2+k[/latex]
What is [latex]a[/latex], [latex]h[/latex], and [latex]k[/latex] in figure 9? The quadratic function of the graph below written in vertex form is [latex]y=-3{\left(x+2\right)}^{2}+4[/latex]. In this form, [latex]a=-3,\text{ }h=-2[/latex], and [latex]k=4[/latex]. Since [latex]a<0[/latex], the parabola opens downward. The vertex is at [latex]\left(-2,\text{ 4}\right)[/latex].
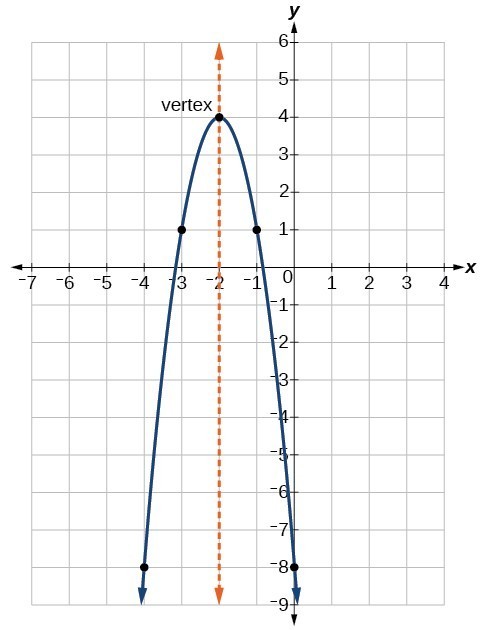
Figure 9 [latex]-3(x+2)^2+4[/latex]
If [latex]k>0[/latex], the graph shifts upward, whereas if [latex]k<0[/latex], the graph shifts downward. In Figure 9, [latex]k>0[/latex], so the graph is shifted [latex]4[/latex] units upward.
If [latex]h>0[/latex], the graph shifts toward the right and if [latex]h<0[/latex], the graph shifts to the left. In Figure 9, [latex]h<0[/latex], so the graph is shifted [latex]2[/latex] units to the left. In Figure 9, [latex]|a|>1[/latex]. The magnitude of [latex]a[/latex] indicates the stretch of the graph. When [latex]|a|>1[/latex] there is a vertical stretch causing the graph to become narrower.
