Learning Objectives
- Graph quadratic functions in intercept form [latex]f(x)=a(x-p)(x-q)[/latex].
- Use the Zero-Product Property to solve quadratic equations in intercept form.
- Find the [latex]x[/latex]-intercepts, [latex]y[/latex]-intercept, axis of symmetry, and vertex of a quadratic function in intercept form.
Graphing Quadratics in Intercept Form [latex]f(x)=a(x-p)(x-q)[/latex]
In this section we will be graphing quadratic functions that are written in intercept form. When quadratic functions are written in this form, it is easy to identify the [latex]x[/latex]-intercepts. In order to graph the parabola, we will also need to determine the vertex, [latex]y[/latex]-intercept, and the axis of symmetry. For reference, Figure 1 illustrates important features of a parabola that you learned about in the last section.
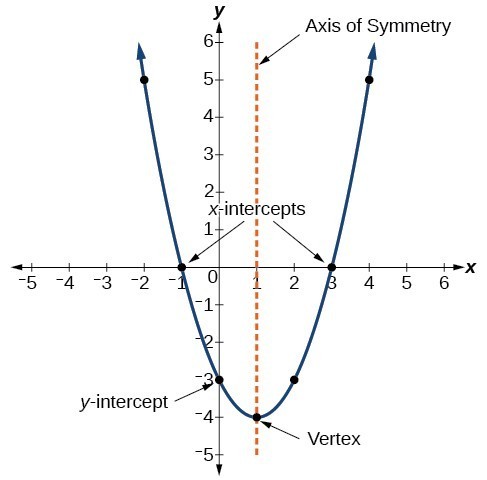
Figure 1
To find the [latex]x[/latex]-intercepts of a quadratic equation in intercept form, we first need to learn about the Zero-Product Property.
What if we told you that we multiplied two numbers together and got an answer of zero? What could you say about the two numbers? Could they be [latex]2[/latex] and [latex]5[/latex]? Could they be [latex]9[/latex] and [latex]1[/latex]? No! When the result (answer) from multiplying two numbers is zero, that means that one of them had to be zero. This idea is called the Zero-Product Property, and it is useful for solving polynomial equations that can be factored.
The Zero-Product Property
The Zero-Product Property states: If the product of two numbers is zero, then at least one of the numbers is zero. That is
[latex]\text{If }a\cdot b=0,\text{ then }a=0\text{ or }b=0[/latex] or both [latex]a[/latex] and [latex]b[/latex] are [latex]0[/latex].
where [latex]a[/latex] and [latex]b[/latex] are real numbers or algebraic expressions.
ExAMPLE
- Solve [latex](x-4)(x+7)=0[/latex] using the Zero-Product Property.
- Solve [latex](x+3)(2x-5)=0[/latex] using the Zero-Product Property.
Show Solution
1. Solve [latex](x-4)(x+7)=0[/latex] using the Zero-Product Property.
We have the product of two algebraic expressions, [latex]x-4[/latex] and [latex]x+7[/latex], by the Zero-Product Property at least one of the factors must equal [latex]0[/latex]. We need to set each of these factors equal to zero then solve for [latex]x[/latex].
[latex]\begin{align}\require{color}x-4=0 && or\quad\quad x+7=0 &&\color{blue}\textsf{add or subtract}\end{align}[/latex]
[latex]\require{color}\hspace{5mm}\underline{\color{Green}{+4}\hspace{2mm}+4}\hspace{2.7cm}\underline{\color{Green}{-7}\hspace{2mm}-7}[/latex]
[latex]\hspace{1cm} x = 4\hspace{3cm} x = -7[/latex]
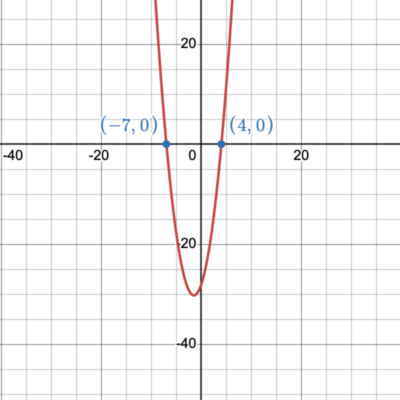
These solutions are the [latex]x[/latex]-intercepts of the quadratic function [latex]f(x)=(x-4)(x+7)[/latex]. We can write both of the [latex]x[/latex]-intercepts as ordered pairs. The [latex]x[/latex]-intercepts are [latex](4,0), (-7,0)[/latex].
When we look at the graph of this function, we notice that these are the two points where the graph crosses the [latex]x[/latex]-axis.
2. Solve [latex](x+3)(2x-5)=0[/latex] using the Zero-Product Property.
Set both factors equal to zero and solve.
[latex]\begin{align}x+3=0 && or\quad\quad 2x-5=0 &&\color{blue}\textsf{add or subtract}\end{align}[/latex]
[latex]\require{color}\hspace{5mm}\underline{\color{Green}{-3}\hspace{2mm}-3}\hspace{2.7cm}\underline{\color{Green}{+5}\hspace{3mm}+5}[/latex]
[latex]\begin{align}\hspace{8mm} x = -3\hspace{2.7cm}\dfrac{2x}{2} = \dfrac{5}{2} &&\color{blue}\textsf{divide}\end{align}[/latex]
[latex]\hspace{5.2cm} x=\dfrac{5}{2}[/latex] or [latex]x=2.5[/latex]
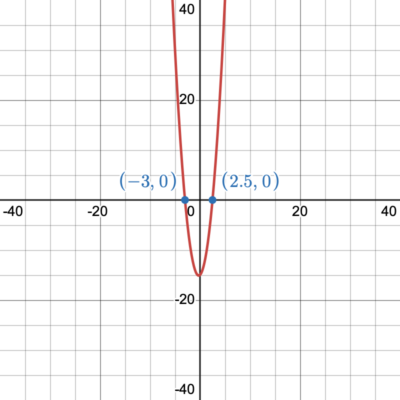
These solutions are the [latex]x[/latex]-intercepts of the quadratic function [latex]f(x)=(x+3)(2x-5)[/latex]. We will write both of the [latex]x[/latex]-intercepts as ordered pairs. The [latex]x[/latex]-intercepts are [latex](-3,0),(2.5, 0)[/latex].
When we look at the graph of this function, we notice that these are the two points where the graph crosses the [latex]x[/latex]-axis.
ExAMPLE
Graph the parabola [latex]f(x)=(x+2)(x+4)[/latex] by first finding the [latex]x[/latex]-intercept(s), [latex]y[/latex]-intercept, axis of symmetry, and the vertex.
Show Solution
We can rewrite the function as [latex]y=(x+2)(x+4)[/latex].
Find [latex]x[/latex]-intercepts:
Let [latex]y=0[/latex], and solve for [latex]x[/latex].
[latex]0=(x+2)(x+4)[/latex]
By the Zero-Product Property, we can set each of these factors equal to zero then solve for [latex]x[/latex].
[latex]\begin{align}\require{color}x+2=0 && or\quad\quad x+4=0 &&\color{blue}\textsf{subtract}\end{align}[/latex]
[latex]\require{color}\hspace{5mm}\underline{\color{Green}{-2}\hspace{2mm}-2}\hspace{2.7cm}\underline{\color{Green}{-4}\hspace{2mm}-4}[/latex]
[latex]\hspace{8mm} x = -2\hspace{2.8cm} x = -4[/latex]
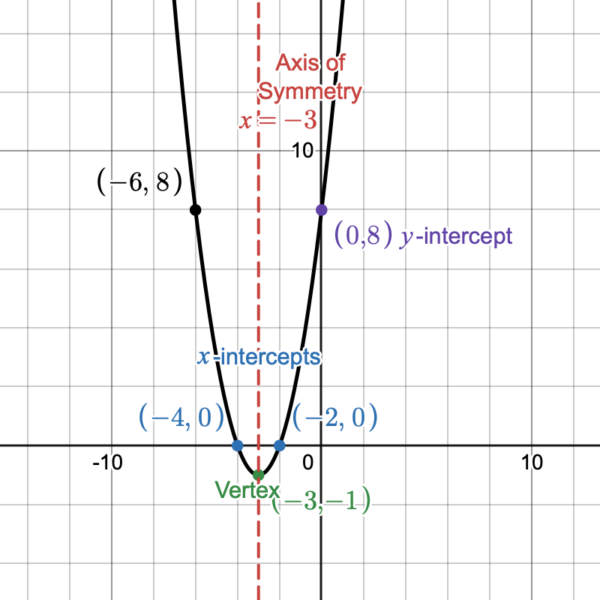
The [latex]\require{color}\color{MidnightBlue}{x-\textsf{intercepts are }{(-2,0),(-4,0)}}[/latex].
Find [latex]y[/latex]-intercept:
Let [latex]x=0[/latex] and solve for [latex]y[/latex].
[latex]y=(0+2)(0+4)[/latex]
[latex]y=(2)(4)[/latex]
[latex]y=8[/latex]
The [latex]\color{RoyalPurple}{y-\textsf{intercept is }{(0,8)}}[/latex].
Find the Axis of Symmetry:
The axis of symmetry of a parabola is a vertical line that divides the parabola into two equal parts. It always passes through the vertex. Finding the axis of symmetry will also help us find the vertex.
Remember that quadratic functions in intercept form are in the form of [latex]f(x)=(x-p)(x-q)[/latex].
Above we found that the [latex]x[/latex]-intercepts are the points [latex](-2,0)[/latex] and [latex](-4,0)[/latex]. We need to find the [latex]x[/latex]-value that is halfway between [latex]-2[/latex] and [latex]-4[/latex]. To do this we can find the average of the [latex]x[/latex]-intercepts.
[latex]\begin{align}x=&\dfrac{p+q}{2}\\\\ x=&\dfrac{-2+(-4)}{2}\\\\ x=&\dfrac{-6}{2}\\\\ x=&-3\end{align}[/latex]
[latex]\color{BrickRed}{\textsf{The axis of symmetry is the vertical line}\hspace{2mm}{x=-3}}[/latex].
Find the Vertex:
The axis of symmetry will help us find the vertex. The [latex]x[/latex]-coordinate is [latex]-3[/latex]. To find the [latex]y[/latex]-coordinate we will replace the [latex]\color{Green}{x}[/latex]‘s with [latex]\color{Green}{-3}[/latex] in the function [latex]y=(x+2)(x+4)[/latex].
[latex]\begin{align}y=&(\color{Green}{-3}\color{black}{+2)(}\color{Green}{-3}\color{black}{+4)}\\ y=& (-1)(1)\\ y=&-1\end{align}[/latex]
[latex]\color{OliveGreen}{\textsf{The vertex is} (-3,-1).}[/latex] The vertex is the minimum value at [latex](-3,-1)[/latex].
Graph it:
Now graph the four points we found [latex](-2,0), (-4,0), (0,8), (-3,-1)[/latex] and the line of symmetry [latex]x=-3[/latex]. Since parabolas are symmetrical, we could find another point that is symmetric to the point [latex](0,8)[/latex]. Notice that [latex](0,8)[/latex] is right [latex]3[/latex] units of the axis of symmetry. If we go [latex]3[/latex] units to the left of the axis of symmetry, we are at the point [latex](-6,8)[/latex]. Which is another point on the graph of this function.
ExAmple
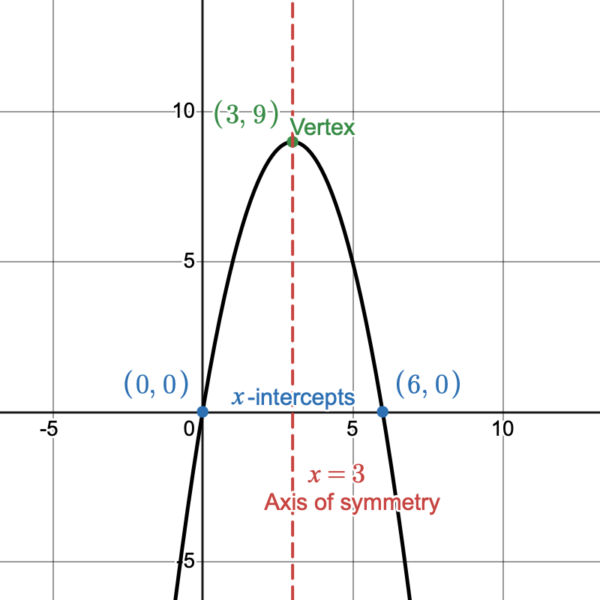
Find the [latex]x[/latex]-intercept(s), [latex]y[/latex]-intercept, axis of symmetry, and the vertex of [latex]f(x)=-x(x-6)[/latex]. Then graph the parabola.
Show Solution
We can rewrite the function as [latex]y=-x(x-6)[/latex].
Find [latex]x[/latex]-intercepts:
Let [latex]y=0[/latex], and solve for [latex]x[/latex].
[latex]0=-x(x-6)[/latex]
By the Zero-Product Property, we can set each of these factors equal to zero then solve for [latex]x[/latex].
[latex]\begin{align}\require{color}-x=0 && or && x-6=0\end{align}[/latex]
[latex]\dfrac{-x}{\color{Green}{-1}}\color{black}{=}\dfrac{0}{\color{Green}{-1}} \hspace{2.2cm}\underline{\color{Green}{+6}\hspace{2mm}+6}[/latex]
[latex]\hspace{5mm} x = 0\hspace{3cm} x = 6[/latex]
The [latex]\require{color}\color{MidnightBlue}{x-\textsf{intercepts are }{(0,0),(6,0)}}[/latex].
Find [latex]y[/latex]-intercept:
Let [latex]x=0[/latex] and solve for [latex]y[/latex].
[latex]y=-(0)(0-6)[/latex]
[latex]y=(0)(-6)[/latex]
[latex]y=0[/latex]
The [latex]\color{RoyalPurple}{y-\textsf{intercept is }{(0,0)}}[/latex].
Notice that the [latex]y[/latex]-intercept is the same as one of our [latex]x[/latex]-intercepts, so this didn’t give us any new information.
Find the Axis of Symmetry:
The [latex]x[/latex]-intercepts are [latex](0,0)[/latex] and [latex](6,0)[/latex]. We need to find the [latex]x[/latex]-value that is halfway between [latex]0[/latex] and [latex]6[/latex]. We need to find the average of the [latex]x[/latex]-intercepts.
[latex]\begin{align}x=&\dfrac{0+6}{2}\\\\ x=&\dfrac{6}{2}\\\\ x=&3\end{align}[/latex]
[latex]\color{BrickRed}{\textsf{The axis of symmetry is the vertical line}\hspace{2mm}{x=3}}[/latex].
Find the Vertex:
The axis of symmetry is [latex]x=3[/latex], which tells us the [latex]x[/latex]-coordinate of the vertex is also [latex]3[/latex]. To find the [latex]y[/latex]-coordinate we will replace the [latex]\color{Green}{x}[/latex]‘s with [latex]\color{Green}{3}[/latex] in the function [latex]y=-x(x-6)[/latex].
[latex]\begin{align}y=&(-1\cdot\color{Green}{3}\color{black}{)(}\color{Green}{3}\color{black}{-6)}\\ y=& (-3)(-3)\\ y=&9\end{align}[/latex]
[latex]\color{OliveGreen}{\textsf{The vertex is } (3,9).}[/latex] The vertex is the maximum value at [latex](3,9)[/latex]
Graph it:
Now graph the three points we found [latex](0,0), (6,0), (3,9)[/latex] and the line of symmetry [latex]x=3[/latex]. If needed, you can find more points by choosing [latex]x[/latex]-values and solving for [latex]y[/latex], in the function [latex]y=-x(x-6)[/latex].
ExAMPLE
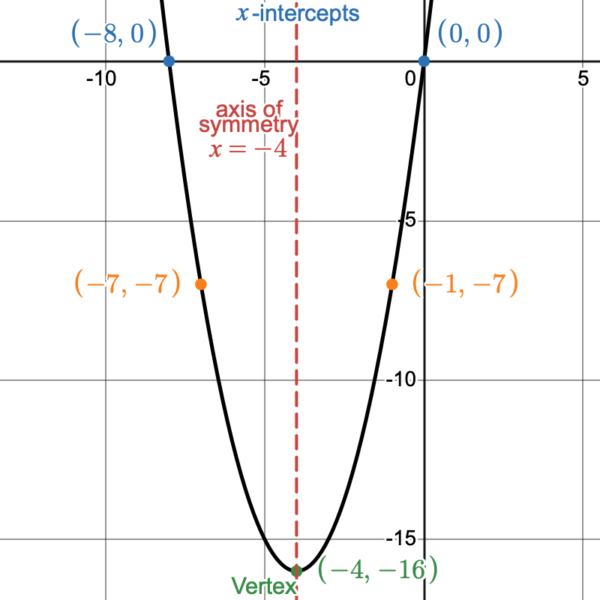
Let [latex]f(x)=x(x+8)[/latex]. Fill in the table and graph the function.
| [latex]x[/latex] |
[latex]f(x)=x(x+8)[/latex] |
|
|
|
|
|
|
|
|
|
|
Show Solution
Let’s figure out the most efficient [latex]x[/latex]-values to choose for the given function.
- Which values for [latex]x[/latex] will help us find the [latex]x[/latex]-intercepts? In other words, which values for [latex]x[/latex] will make each factor [latex]0[/latex]?
- We have the factors [latex]x[/latex] and [latex]x+8[/latex]. The only value that can make the factor of [latex]x[/latex] zero, is [latex]0[/latex] itself. With the other factor of [latex]x+8[/latex], [latex]-8[/latex] is the only value that will make that factor zero. Let’s start by selecting those values for [latex]x[/latex] and put them in the table.
- Another important part of a parabola is the [latex]y[/latex]-intercept. We already found the [latex]y[/latex]-intercept by choosing [latex]0[/latex] as a [latex]x[/latex]-value. The point [latex](0,0)[/latex] is both the [latex]x[/latex]-intercept and the [latex]y[/latex]-intercept.
| [latex]x[/latex] |
[latex]f(x)=x(x+8)[/latex] |
[latex]Ordered[/latex] [latex]Pair[/latex] |
|
| [latex]0[/latex]
|
[latex]0(0+8)[/latex]
[latex](0)(8)[/latex]
[latex]= 0[/latex] |
[latex](0,0)[/latex]
|
[latex]x-intercept[/latex]
and
[latex]y-intercept[/latex] |
|
|
|
|
|
|
|
|
|
|
|
|
| [latex]-8[/latex]
|
[latex]-8(-8+8)[/latex]
[latex](-8)(0)[/latex]
[latex]= 0[/latex] |
[latex](-8,0)[/latex]
|
[latex]x-intercept[/latex]
|
- What would be a good [latex]x[/latex]-value to choose that is between the [latex]x[/latex]-intercepts?
- Choosing an [latex]x[/latex]-value that is exactly halfway between the [latex]x[/latex]-intercepts will give us the vertex, which is another important part of a parabola. [latex]\dfrac{0+(-8)}{2}=\dfrac{-8}{2}=-4[/latex]. Let’s choose [latex]-4[/latex] for the next [latex]x[/latex]-value.
- The axis of symmetry is a vertical line that passes through the vertex. So, the axis of symmetry is [latex]x= -4[/latex].
- We could choose two other [latex]x[/latex]-values that are between [latex]0[/latex] and [latex]-8[/latex], to get a better idea of what the graph looks like. Such as [latex]x=-1[/latex] or [latex]x=-7[/latex].
| [latex]x[/latex] |
[latex]f(x)=x(x+8)[/latex] |
[latex]Ordered[/latex] [latex]Pair[/latex] |
|
| [latex]0[/latex]
|
[latex]0(0+8)[/latex]
[latex](0)(8)[/latex]
[latex]= 0[/latex] |
[latex](0,0)[/latex]
|
[latex]x-intercept[/latex]
and
[latex]y-intercept[/latex] |
| [latex]-1[/latex]
|
[latex]-1(-1+8)[/latex]
[latex](-1)(7)[/latex]
[latex]= -7[/latex] |
[latex](-1,-7)[/latex]
|
[latex]other[/latex]
[latex]point[/latex] |
| [latex]-4[/latex]
|
[latex]-4(-4+8)[/latex]
[latex](-4)(4)[/latex]
[latex]= -16[/latex] |
[latex](-4,-16)[/latex]
|
[latex]vertex[/latex]
|
| [latex]-7[/latex]
|
[latex]-7(-7+8)[/latex]
[latex](-7)(1)[/latex]
[latex]= -7[/latex] |
[latex](-7,-7)[/latex]
|
[latex]other[/latex]
[latex]point[/latex] |
| [latex]-8[/latex]
|
[latex]-8(-8+8)[/latex]
[latex](-8)(0)[/latex]
[latex]= 0[/latex] |
[latex](-8,0)[/latex]
|
[latex]x-intercept[/latex]
|
ExAMPLE
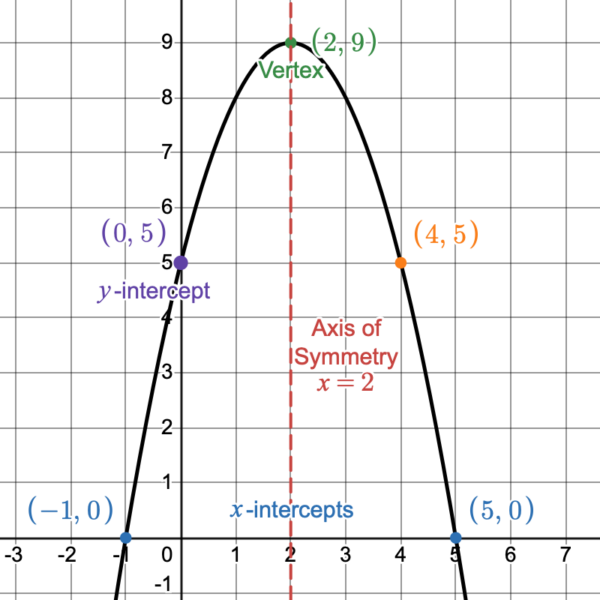
Let [latex]f(x)=(x+1)(5-x)[/latex]. Fill in the table and graph the function.
| [latex]x[/latex] |
[latex]f(x)=(x+1)(5-x)[/latex] |
|
|
|
|
|
|
|
|
|
|
Show Solution
The function [latex]f(x)=(x+1)(5-x)[/latex] can also be written as [latex]y=(x+1)(5-x)[/latex]. Remember the [latex]f(x)[/latex] notation, indicates that the equation is a function.
Let’s figure out the most efficient [latex]x[/latex]-values to choose for the given function.
- Which values for [latex]x[/latex] will make each factor [latex]0[/latex]? In other words, how would we find the [latex]x[/latex]-intercepts?
- We have the factors [latex]x+1[/latex] and [latex]5-x[/latex]. The value that makes the factor of [latex]x+1[/latex] zero, is [latex]-1[/latex]. With the other factor of [latex]5-x[/latex], [latex]5[/latex] is the value that makes that factor zero. Let’s start by selecting those values for [latex]x[/latex] and put them in the table.
- How would we find where the graph crosses the [latex]y[/latex]-axis? In other words, what is the [latex]y[/latex]-intercept?
- Another important part of a parabola is the [latex]y[/latex]-intercept. To find the [latex]y[/latex]-intercept, let [latex]x=0[/latex] and solve for y.
| [latex]x[/latex] |
[latex]f(x)=(x+1)(5-x)[/latex] |
[latex]Ordered[/latex] [latex]Pair[/latex] |
|
| [latex]-1[/latex]
|
[latex](-1+1)(5-(-1))[/latex]
[latex](0)(6)[/latex]
[latex]= 0[/latex] |
[latex](-1,0)[/latex]
|
[latex]x-intercept[/latex]
|
| [latex]0[/latex]
|
[latex](0+1)(5-0)[/latex]
[latex](1)(5)[/latex]
[latex]= 5[/latex] |
[latex](0,5)[/latex]
|
[latex]y-intercept[/latex]
|
|
|
|
|
|
|
|
|
| [latex]5[/latex]
|
[latex](5+1)(5-5)[/latex]
[latex](6)(0)[/latex]
[latex]= 0[/latex] |
[latex](5,0)[/latex]
|
[latex]x-intercept[/latex]
|
- What would be a good [latex]x[/latex]-value to choose that is between the [latex]x[/latex]-intercepts?
- Choosing an [latex]x[/latex]-value that is exactly halfway between the [latex]x[/latex]-intercepts will give us the vertex, which is another important part of a parabola. [latex]\dfrac{-1+5}{2}=\dfrac{4}{2}=2[/latex]. Let’s choose [latex]2[/latex] as the next [latex]x[/latex]-value to put in the table.
- Do we have enough information to find the axis of symmetry?
- The axis of symmetry is a vertical line that passes through the vertex. So, the axis of symmetry is the line [latex]x= 2[/latex]
- Is there another point on the graph that would be helpful and easy to find?
- Since parabolas are symmetrical to the axis of symmetry. We can find another point on the graph by determining which point is symmetric to the [latex]y[/latex]-intercept, [latex](0,5)[/latex]. The axis of symmetry is a vertical line that divides the parabola in two halves. The point [latex](0,5)[/latex] is [latex]2[/latex] places to the left of the axis of symmetry, so we will find another point [latex]2[/latex] places to the right of the axis of symmetry, so another point on the graph is [latex](4,5)[/latex].
| [latex]x[/latex] |
[latex]f(x)=(x+1)(5-x)[/latex] |
[latex]Ordered[/latex] [latex]Pair[/latex] |
|
| [latex]-1[/latex]
|
[latex](-1+1)(5-(-1))[/latex]
[latex](0)(6)[/latex]
[latex]= 0[/latex] |
[latex](-1,0)[/latex]
|
[latex]x-intercept[/latex]
|
| [latex]0[/latex]
|
[latex](0+1)(5-0)[/latex]
[latex](1)(5)[/latex]
[latex]= 5[/latex] |
[latex](0,5)[/latex]
|
[latex]y-intercept[/latex]
|
| [latex]2[/latex]
|
[latex](2+1)(5-2)[/latex]
[latex](3)(3)[/latex]
[latex]= 9[/latex] |
[latex](2,9)[/latex]
|
[latex]vertex[/latex]
|
|
Find using the [latex]y-intercept[/latex] and axis of symmetry
|
[latex](4,5)[/latex]
|
[latex]other[/latex]
[latex]point[/latex] |
| [latex]5[/latex]
|
[latex](5+1)(5-5)[/latex]
[latex](6)(0)[/latex]
[latex]= 0[/latex] |
[latex](5,0)[/latex]
|
[latex]x-intercept[/latex]
|
Let’s graph and label the points we found, [latex](-1,0), (0,5), (2,9), (4,5),[/latex] and [latex](5,0)[/latex]. Then graph and label the axis of symmetry.
Below, think about the function given in regards to graphing it. It is written in general form which will be discussed more in the next section. When we try to graph it, we find something interesting.
THink About it
Consider the function [latex]g(x)=x^2+5x+6[/latex].
What are some efficient [latex]x[/latex]-values we can choose to find important features of the parabola?
If we let [latex]\color{Plum}{x=0}[/latex], we can find the [latex]\color{Plum}{\textsf{y-intercept}}[/latex].
$$\begin{align}
g(\color{Plum}{\textbf{0}}\color{black}{)} &= (\color{Plum}{\textbf{0}}\color{black}{)^2+5(}\color{Plum}{\textbf{0}}\color{black}{)+6} \\ &= 6 \end{align}$$
The [latex]y[/latex]-intercept is [latex](0,6)[/latex]
To find the [latex]x[/latex]-intercept(s), let [latex]y=0[/latex] and solve for [latex]x[/latex].
[latex]0=x^2+5x+6[/latex]
How can we solve this equation for x?
It looks like we might need something else to help us find the [latex]x[/latex]-intercept(s).
How can we write this equation in intercept form?
We discovered earlier in this lesson that it is easy to find the [latex]x[/latex]-intercept(s) in intercept form, using the Zero-Product property. Let’s skip finding the [latex]x[/latex]-intercept(s) and work on finding the vertex.
We learned that the vertex is exactly half-way between the [latex]x[/latex]-intercepts because of the symmetry of parabolas. We were not able to find the [latex]x[/latex]-intercepts so we cannot find the vertex using this method. If we knew the vertex, we could also find the axis of symmetry.
We could choose random values for [latex]x[/latex] and determine the [latex]y[/latex]-values but these [latex]x[/latex]-values we choose will not necessarily help us find the important features of this parabola.
It is apparent that it is more difficult to find the [latex]x[/latex]-intercept(s), vertex, and axis of symmetry if the function is not in intercept form. Intercept form is sometimes called factored form. Learning more about factoring will be useful for us. Factoring is a great skill to develop and is helpful for this course as well as subsequent courses.
Summary
- [latex]x[/latex]-intercepts are easy to find when function is written in intercept form [latex]f(x)=(x-p)(x-q)[/latex] and harder to determine in general form [latex]f(x)=ax^2+bx+c[/latex].
- The Zero-Product Property can be used to solve equations of the form [latex](x+a)(x+b)=0[/latex] by setting each factor equal to 0, [latex]x+a=0[/latex] and [latex]x+b=0[/latex].
- The vertex can be found in intercept form by finding the point that is half-way between the [latex]x[/latex]-intercepts.
- Th axis of symmetry is the vertical line that divides the parabola into two equal halves that passes through the vertex. It is easy to find when you know the vertex.
- The [latex]y[/latex]-intercept can be found easily by letting [latex]x=0[/latex] and solving for [latex]y[/latex].
- Parabolas are “U”-shaped graphs with a smooth curve. The graph should be rounded at the vertex. Parabolas are NOT “V”-shaped graphs.


