Learning Objectives
- Solve quadratic inequalities, expressing the solution set using interval notation.
A quadratic inequality is a quadratic equation, but with the equal sign replaced by an inequality sign. An example of a quadratic inequality is
[latex]x^2-3x-4\leq 0[/latex]
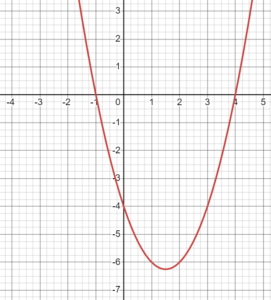
To help solve this, we will consider the quadratic function [latex]f(x)=x^2-3x-4[/latex]. Solving our inequality above is equivalent to asking which [latex]x[/latex] values cause the output value of the function [latex]f[/latex] to be less than or equal to [latex]0[/latex]. We will use a graph of the function [latex]f[/latex] to understand this idea. Below is the graph of the function [latex]f[/latex]. Note that the function factors as [latex]f(x)=(x-4)(x+1)[/latex], which reveals the two [latex]x[/latex]-intercepts of [latex](-1,0)[/latex] and [latex](4, 0)[/latex].

Try to use the above graph to solve the inequality [latex]f(x) \leq 0[/latex] before revealing the answer below.
Try It
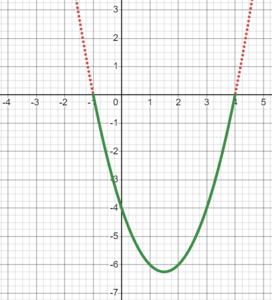
Solve the inequality [latex]x^2-3x-4\leq 0[/latex] by graphing.
We can see from the above example that the key was to use the places where the graph crosses the [latex]x[/latex]-axis as the endpoints of our solution interval.
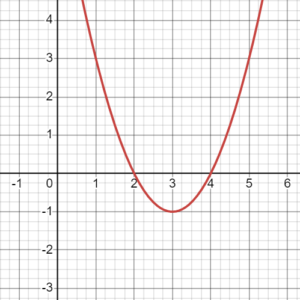
Here is another example to try. Note the small differences in the setup of the problem.
EXAMPLE
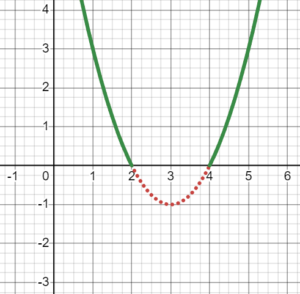
Solve the inequality [latex]x^2-6x+8 > 0[/latex].
Using a Number Line
We can see from the above examples that the [latex]x[/latex]-intercepts of the function associated with the inequality are crucial to the solving process and end up being the endpoints of the solution intervals. This is because a parabola is a smooth curve and can only pass from above to below the [latex]x[/latex]-axis by passing through the axis first (resulting in an intercept).
This suggests an alternative approach to solving which does not require graphing the parabola. We can determine the “boundary values” where the inequality can pass from being true to false, then use test points to determine which intervals on the number line are true or false. This is similar to the test point approach used in solving systems of inequalities in Chapter 2.
Consider the inequality [latex]x^2+2x-15>0[/latex]. Solving the related equation [latex]x^2+2x-15=0[/latex] gives us the boundary values which separate solutions from non-solutions on the number line. This equation can be solved by factoring:
[latex]\begin{align}x^2+2x-15&=0\\ (x+5)(x-3)&=0\\ x+5=0 \textsf{ or } x-3&=0\\ x=-5 \textsf{ or } x&=3 \end{align}[/latex]
Thus the inequality can switch from being true to false or false to true at these two values. We can test [latex]x[/latex] values in each of the three number line regions separated by these boundary values to determine if each interval represents solutions or non-solutions.

Number line for testing values
The big dots represent the boundary values and the red Xs represent the test points we will use.
Substituting each test value in the original inequality [latex]x^2+2x-15>0[/latex],
Test [latex]-6[/latex]: [latex](-6)^2+2(-6)-15 > 0[/latex], or [latex]9>0[/latex] which is TRUE.
Test [latex]0[/latex]: [latex](0)^2+2(0)-15 > 0[/latex], or [latex]-15>0[/latex] which is FALSE.
Test [latex]4[/latex]: [latex](4)^2+2(4)-15 > 0[/latex], or [latex]9>0[/latex] which is TRUE.
Thus the solution is [latex](-\infty, -5) \cup (3, \infty)[/latex], using parentheses at the boundary values because the inequality was strict.
Let’s try a few more examples using this approach.
EXAMPLE
Solve the inequality [latex]x^2 \leq 4x + 5[/latex].
You may have noticed a pattern of the intervals alternating between true and false. Though this is a keen observation, the next example will prove this is not always the case!
EXAMPLE
Solve the inequality [latex]2x^2+8x+8 > 0[/latex].
The boundary value and test point method for solving quadratic inequalities will be more generally useful for you in future math courses, where you may solve polynomial or rational inequalities.
Summary
A quadratic inequality can be solved by two different methods. First make sure [latex]0[/latex] is on one side of the inequality.
One method is to graph the corresponding parabola and determine for which [latex]x[/latex]-values the parabola is above or below the [latex]x[/latex]-axis.
The other method is to find the endpoints of the solution intervals, called boundary values, by turning the inequality into an equation and solving. Separate the number line into intervals using the boundary values. We can test each resulting interval using a test point to determine whether that interval is in the solution set or not.


