You have just learned how polynomials are defined and how algebraic principles can be applied to polynomials. In future math courses, you will likely learn how to graph polynomials, as we did with linear equations. For example, in the last section on cost, revenue, and profit equations we wrote a polynomial that represented the profit for a cell phone company.
[latex]P=-0.09x^2+5000x-750,000[/latex]
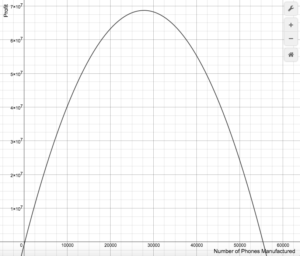
Using an online graphing calculator, we generated this graph of the profit equation.

The x-axis represents the number of phones manufactured, and the y-axis represents the profit earned by the company. Because the company must invest money into machinery and workforce to manufacture phones, when no phones have been made the profit for the company is negative. In other words, the point (0,-750,000) represents no phones made and $750,000 invested.
The top of the curve represents the “sweet spot” that many business would like to achieve between making and spending money. Using some tools from later math classes, we can find that the maximum amount of profit can be gained from producing 27,777 phones.
Polynomials have many practical uses and have been studied widely by mathematicians for many years. Our vast knowledge of how they behave mixed with high speed computing allows us to continue to find even more uses for them.