Learning Objectives
- Identify graphs and solutions of equations and inequalities
- Identify the similarities and differences between solutions for linear equations in two variables and linear inequalities in two variables
- Identify the similarities and differences between graphs for linear equations in two variables and linear inequalities in two variables
- Graph an inequality in two variables
- Identify and follow steps for graphing a linear inequality in two variables
Identify the difference between the graph of a linear equation and linear inequality
Recall that solutions to linear inequalities are whole sets of numbers, rather than just one number, like you find with solutions to equalities (equations).
Here is an example from the section on solving linear inequalities:
Solve for p. [latex]4p+5<29[/latex]
[latex]\displaystyle \begin{array}{l}4p+5<\,\,\,29\\\underline{\,\,\,\,\,\,\,\,\,-5\,\,\,\,\,\,\,-5}\\\underline{4p}\,\,\,\,\,\,\,\,<\,\,\underline{24}\,\,\\4\,\,\,\,\,\,\,\,\,\,\,\,\,\,\,\,\,\,\,\,\,\,\,4\\\,\,\,\,\,\,\,\,\,\,\,p<6\end{array}[/latex]
You can interpret the solution as p can be any number less than six. Now recall that we can graph equations of lines by defining the outputs, y, and the inputs, x, and writing an equation.
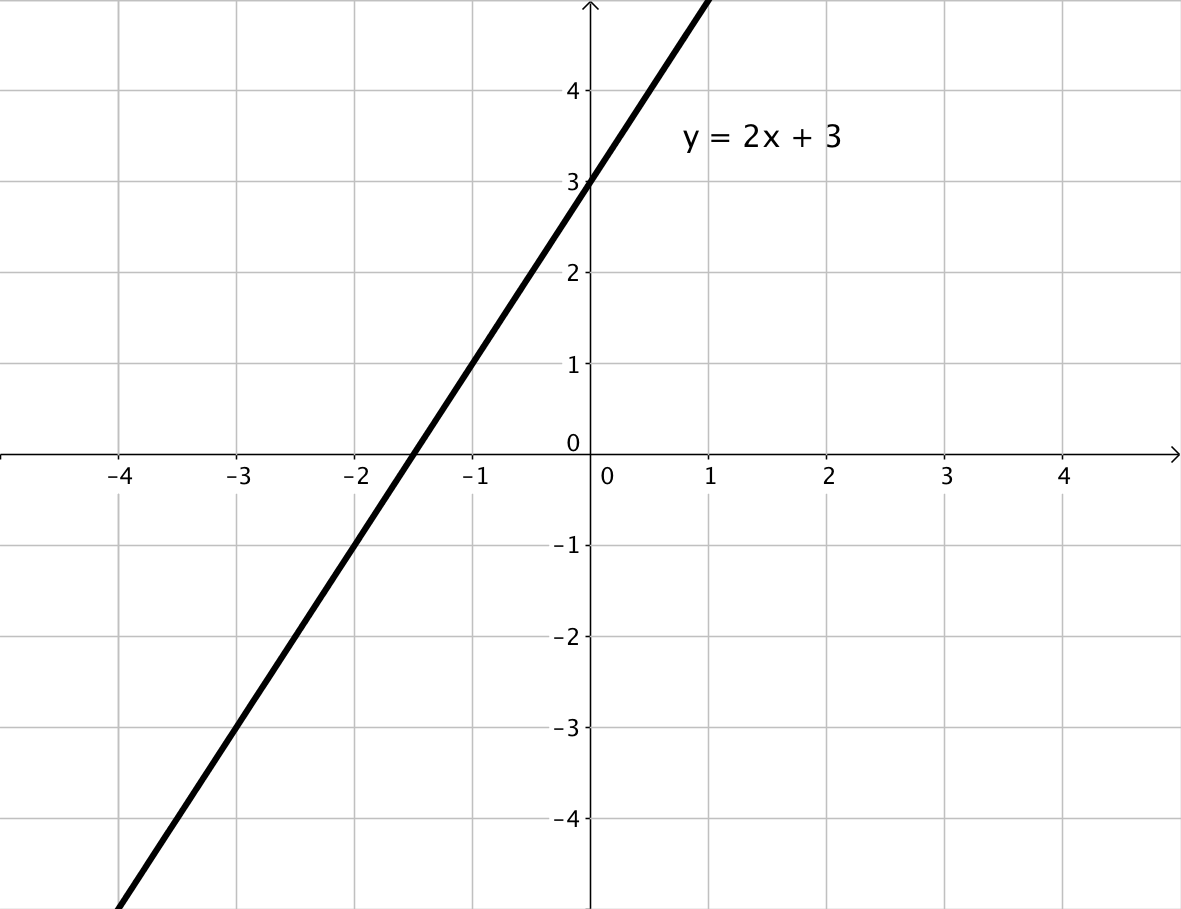
Previously, we showed how to graph the line described by this equation: [latex]y=2x+3[/latex] and found that we can construct a never-ending table of values that make points on the line—these are some of the solutions to the equation [latex]y=2x+3[/latex].
| x values | [latex]2x+3[/latex] | y values |
|---|---|---|
| 0 | [latex]2(0)+3[/latex] | 3 |
| 1 | [latex]2(1)+3[/latex] | 5 |
| 2 | [latex]2(2)+3[/latex] | 7 |
| 3 | [latex]2(3)+3[/latex] | 9 |
Additionally, we learned how to graph the line that represents all the points that make [latex]y=2x+3[/latex] a true statement.
What if we combined these two ideas—linear inequalities and graphs of lines? First translate the line, [latex]y=2x+3[/latex], into words:
You get y by multiplying x by two and adding three. [latex]y=2x+3[/latex]
How would you translate this inequality into words? [latex]y<2x+3[/latex] For what values of x will you get an output, y, that is less than 2 times x plus three?
WOW, that may seem confusing, but keep reading, we’ll help you figure it out.
Linear inequalities are different than linear equations, although you can apply what you know about equations to help you understand inequalities. Inequalities and equations are both math statements that compare two values. Equations use the symbol = ; recall that inequalities are represented by the symbols < , ≤ , > , and ≥.
One way to visualize two-variable inequalities is to plot them on a coordinate plane. Here is what the inequality [latex]x>y[/latex] looks like. The solution is a region, which is shaded. This region is made up of lots and lots of ordered pairs that all make the statement [latex]x>y[/latex] true.
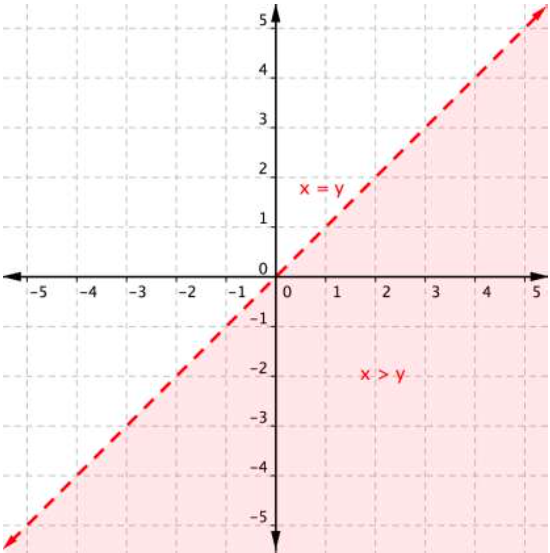
There are a few things to notice here. First, look at the dashed red boundary line: this is the graph of the related linear equation [latex]x=y[/latex]. Next, look at the light red region that is to the right of the line. This region (excluding the line [latex]x=y[/latex]) represents the entire set of solutions for the inequality [latex]x>y[/latex]. Remember how all points on a line are solutions to the linear equation of the line? Well, all points in a region are solutions to the linear inequality representing that region.
Let’s think about it for a moment—if [latex]x>y[/latex], then a graph of [latex]x>y[/latex] will show all ordered pairs [latex](x,y)[/latex] for which the x-coordinate is greater than the y-coordinate.
The graph below shows the region [latex]x>y[/latex] as well as some ordered pairs on the coordinate plane. Look at each ordered pair. Is the x-coordinate greater than the y-coordinate? Does the ordered pair sit inside or outside of the shaded region?
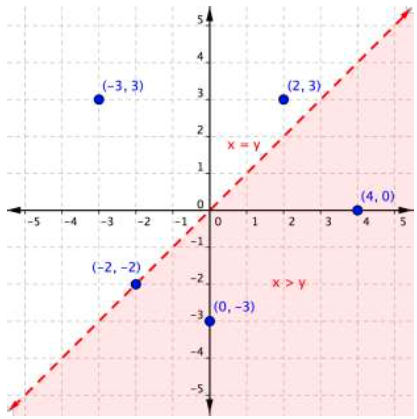
The ordered pairs [latex](4,0)[/latex] and [latex](0,−3)[/latex] lie inside the shaded region. In these ordered pairs, the x-coordinate is larger than the y-coordinate. These ordered pairs are in the solution set of the equation [latex]x>y[/latex].
The ordered pairs [latex](−3,3)[/latex] and [latex](2,3)[/latex] are outside of the shaded area. In these ordered pairs, the x-coordinate is smaller than the y-coordinate, so they are not included in the set of solutions for the inequality.
The ordered pair [latex](−2,−2)[/latex] is on the boundary line. It is not a solution as [latex]−2[/latex] is not greater than [latex]−2[/latex]. However, had the inequality been [latex]x\geq y[/latex] (read as “x is greater than or equal to y”), then [latex](−2,−2)[/latex] would have been included (and the line would have been represented by a solid line, not a dashed line).
The Difference Between a Linear Equation and Linear Inequality (Two Variables)
Let’s take a look at one more example: the inequality [latex]3x+2y\leq6[/latex]. The graph below shows the region of values that makes this inequality true (shaded red), the boundary line [latex]3x+2y=6[/latex], as well as a handful of ordered pairs. The boundary line is solid this time, because points on the boundary line [latex]3x+2y=6[/latex] will make the inequality [latex]3x+2y\leq6[/latex] true.
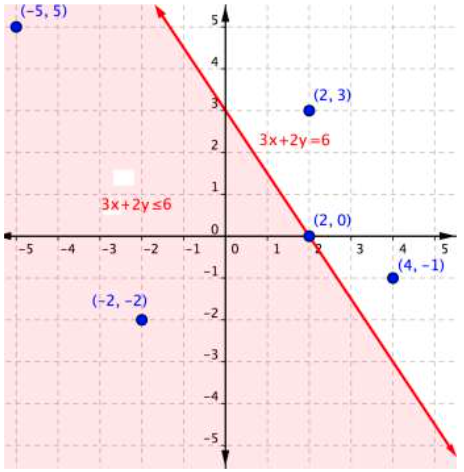
As you did with the previous example, you can substitute the x- and y-values in each of the [latex](x,y)[/latex] ordered pairs into the inequality to find solutions. While you may have been able to do this in your head for the inequality [latex]x>y[/latex], sometimes making a table of values makes sense for more complicated inequalities.
| Ordered Pair | Makes the inequality
[latex]3x+2y\leq6[/latex] a true statement |
Makes the inequality
[latex]3x+2y\leq6[/latex] a false statement |
|---|---|---|
| [latex](−5, 5)[/latex] | [latex]\begin{array}{r}3\left(−5\right)+2\left(5\right)\leq6\\−15+10\leq6\\−5\leq6\end{array}[/latex] | |
| [latex](−2,−2)[/latex] | [latex]\begin{array}{r}3\left(−2\right)+2\left(–2\right)\leq6\\−6+\left(−4\right)\leq6\\–10\leq6\end{array}[/latex] | |
| [latex](2,3)[/latex] | [latex]\begin{array}{r}3\left(2\right)+2\left(3\right)\leq6\\6+6\leq6\\12\leq6\end{array}[/latex] | |
| [latex](2,0)[/latex] | [latex]\begin{array}{r}3\left(2\right)+2\left(0\right)\leq6\\6+0\leq6\\6\leq6\end{array}[/latex] | |
| [latex](4,−1)[/latex] | [latex]\begin{array}{r}3\left(4\right)+2\left(−1\right)\leq6\\12+\left(−2\right)\leq6\\10\leq6\end{array}[/latex] |
If substituting [latex](x,y)[/latex] into the inequality yields a true statement, then the ordered pair is a solution to the inequality, and the point will be plotted within the shaded region or the point will be part of a solid boundary line. A false statement means that the ordered pair is not a solution, and the point will graph outside the shaded region, or the point will be part of a dotted boundary line.
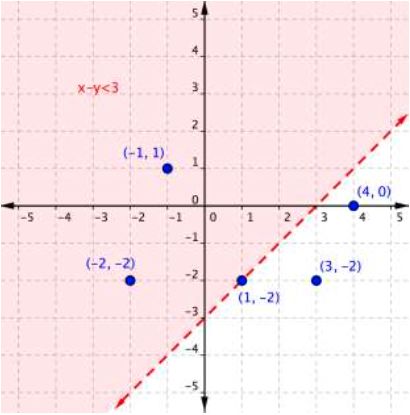
Determine if Ordered Pairs Satisfy a Linear Inequality
Example
Use the graph to determine which ordered pairs plotted below are solutions of the inequality [latex]x–y<3[/latex].
Use a Graph Determine Ordered Pair Solutions of a Linear Inequality in Two Variable
Example
Is [latex](2,−3)[/latex] a solution of the inequality [latex]y<−3x+1[/latex]?
Determine if Ordered Pairs Satisfy a Linear Inequality
Graph an Inequality in Two Variables
So how do you get from the algebraic form of an inequality, like [latex]y>3x+1[/latex], to a graph of that inequality? Plotting inequalities is fairly straightforward if you follow a couple steps.
Graphing Inequalities
To graph an inequality:
- Graph the related boundary line. Replace the <, >, ≤ or ≥ sign in the inequality with = to find the equation of the boundary line.
- Identify at least one ordered pair on either side of the boundary line and substitute those [latex](x,y)[/latex] values into the inequality. Shade the region that contains the ordered pairs that make the inequality a true statement.
- If points on the boundary line are solutions, then use a solid line for drawing the boundary line. This will happen for ≤ or ≥ inequalities.
- If points on the boundary line aren’t solutions, then use a dotted line for the boundary line. This will happen for < or > inequalities.
Let’s graph the inequality [latex]x+4y\leq4[/latex].
To graph the boundary line, find at least two values that lie on the line [latex]x+4y=4[/latex]. You can use the x– and y-intercepts for this equation by substituting 0 in for x first and finding the value of y; then substitute 0 in for y and find x.
| x | y |
| 0 | 1 |
| 4 | 0 |
Plot the points [latex](0,1)[/latex] and [latex](4,0)[/latex], and draw a line through these two points for the boundary line. The line is solid because ≤ means “less than or equal to,” so all ordered pairs along the line are included in the solution set.
The next step is to find the region that contains the solutions. Is it above or below the boundary line? To identify the region where the inequality holds true, you can test a couple of ordered pairs, one on each side of the boundary line.
If you substitute [latex](−1,3)[/latex] into [latex]x+4y\leq4[/latex]:
[latex]\begin{array}{r}−1+4\left(3\right)\leq4\\−1+12\leq4\\11\leq4\end{array}[/latex]
This is a false statement, since 11 is not less than or equal to 4.
On the other hand, if you substitute [latex](2,0)[/latex] into [latex]x+4y\leq4[/latex]:
[latex]\begin{array}{r}2+4\left(0\right)\leq4\\2+0\leq4\\2\leq4\end{array}[/latex]
This is true! The region that includes [latex](2,0)[/latex] should be shaded, as this is the region of solutions.
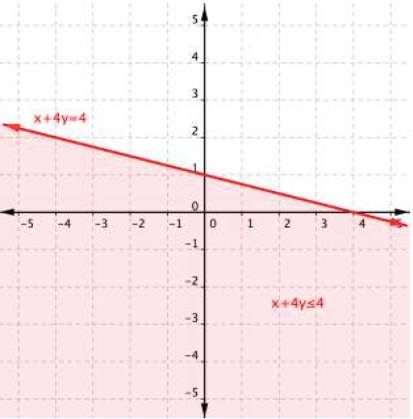
And there you have it—the graph of the set of solutions for [latex]x+4y\leq4[/latex].
Graphing Linear Inequalities in Two Variables
Example
Graph the inequality [latex]2y>4x–6[/latex].
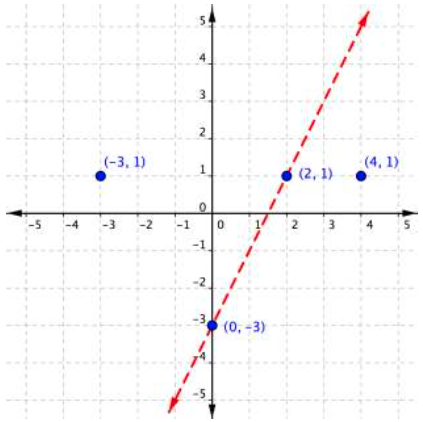
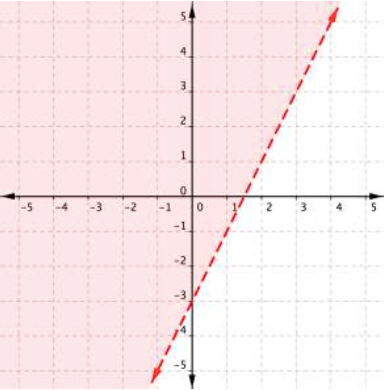
A quick note about the problem above—notice that you can use the points [latex](0,−3)[/latex] and [latex](2,1)[/latex] to graph the boundary line, but that these points are not included in the region of solutions, since the region does not include the boundary line!
Graphing Linear Inequalities in Two Variables (Slope Intercept Form)
Summary
When inequalities are graphed on a coordinate plane, the solutions are located in a region of the coordinate plane, which is represented as a shaded area on the plane. The boundary line for the inequality is drawn as a solid line if the points on the line itself do satisfy the inequality, as in the cases of ≤ and ≥. It is drawn as a dashed line if the points on the line do not satisfy the inequality, as in the cases of < and >. You can tell which region to shade by testing some points in the inequality. Using a coordinate plane is especially helpful for visualizing the region of solutions for inequalities with two variables.
Candela Citations
- The Difference Between a Linear Equation and Linear Inequality (Two Variables). Authored by: Mathispower4u. Located at: https://youtu.be/EcrLbRJ2zV0. License: CC BY: Attribution
- Use a Graph Determine Ordered Pair Solutions of a Linear Inequalty in Two Variable. Authored by: James Sousa (Mathispower4u.com) . Located at: https://youtu.be/GQVdDRVq5_o. License: CC BY: Attribution
- Ex: Determine if Ordered Pairs Satisfy a Linear Inequality. Authored by: James Sousa (Mathispower4u.com) . Located at: https://youtu.be/-x-zt_yM0RM. License: CC BY: Attribution
- Provided by: Monterey Institute of Technology. Located at: http://nrocnetwork.org/resources/downloads/nroc-math-open-textbook-units-1-12-pdf-and-word-formats/. License: CC BY: Attribution
- Ex 2: Graphing Linear Inequalities in Two Variables (Standard Form). Authored by: James Sousa (Mathispower4u.com) for Lumen Learning. Located at: https://youtu.be/2VgFg2ztspI. License: CC BY: Attribution
- Ex 1: Graphing Linear Inequalities in Two Variables (Slope Intercept Form). Authored by: James Sousa (Mathispower4u.com) . Located at: https://youtu.be/Hzxc4HASygU. License: CC BY: Attribution
- Unit 13: Graphing, from Developmental Math: An Open Program. Provided by: Monterey Institute of Technology and Education. Located at: http://nrocnetwork.org/resources/downloads/nroc-math-open-textbook-units-1-12-pdf-and-word-formats/. License: CC BY: Attribution