Key Concepts
After completing this chapter, you will be able to:
- Compare the causes of eutrophication in fresh and marine waters.
- Explain the evidence that phosphorus is usually the limiting nutrient for eutrophication of fresh waters.
- Describe the objectives and technologies used in sewage treatment.
- Explain the role of eutrophication and other stressors in damage caused to the ecosystem of Lake Erie.
- Compare the effects of hydroelectric developments involving reservoirs and run-of-the-river facilities.
- Describe the environmental damage caused by dams and reservoirs.
Introduction
Aquatic ecosystems are affected by many environmental stressors, both natural and anthropogenic. All levels of the aquatic food web are affected, as are ecological processes such as productivity and nutrient cycling. In previous chapters, we examined the use of aquatic resources (Chapter 12) and damage caused by pollution by metals and acidification (Chapters 22 and 23). Here, we look at the effects of eutrophication caused by nutrient enrichment and by hydroelectric developments. Effects on aquatic ecosystems of oil spills, pesticides, forestry, agricultural activities, and urbanization are examined in later chapters.
Eutrophication
Eutrophic waters are well supplied with nutrients, and as a result they are highly productive. In contrast, oligotrophic waters are much less productive because of a restricted availability of nutrients. Mesotrophic waters are intermediate between these two conditions.
Some waterbodies occur in inherently fertile watersheds and are naturally eutrophic. So-called cultural eutrophication, however, is caused by anthropogenic nutrient inputs, usually by the dumping of sewage or runoff of fertilizer from agricultural land. Both inland and marine waters can become eutrophic through increases in their nutrient supply, although the problem is more common in fresh waters.
The most conspicuous symptom of eutrophication is a large increase in primary productivity, especially of phytoplankton, which can develop extremely dense populations known as an algal bloom. Shallow waterbodies may also experience a vigorous growth of aquatic plants (macrophytes). Because the increased productivity of algae and macrophytes can allow higher trophic levels to be more productive, aquatic invertebrates, fish, and waterfowl may also be abundant in eutrophic waterbodies.
However, extremely eutrophic (hypertrophic) waters may become severely degraded. These waterbodies develop noxious blooms of cyanobacteria (blue-green bacteria) and algae during the summer, which may cause an off-flavor in water used for drinking and may also release toxic organic compounds. In addition, decomposition of the algal biomass consumes a large amount of oxygen, which causes anoxic conditions that are extremely stressful and even lethal to aquatic animals.
Because cultural eutrophication degrades water quality and ecological conditions, it is an important problem in many areas. Severe eutrophication may impair the use of a waterbody as a source of drinking water, to support a fishery, or for recreation, and it degrades the ecological qualities of natural waters.
Causes of Eutrophication
Most lakes in in the midwestern and northeastern United States are geologically “young” because they occur on landscapes that were released from glacial ice only about 8-12-thousand years ago (depending on the region). Many lakes are relatively deep, having had little time to accumulate much sediment in their basins. They also tend to have low rates of nutrient input. Over the millennia, however, oligotrophic lakes of this sort gradually increase in productivity as they accumulate nutrients. They also become shallower due to sedimentation, which results in increased rates of nutrient cycling. The slowly increasing productivity of many lakes over time is a natural expression of the eutrophication as a longer-term process.
Surface waters may also be naturally eutrophic if they occur in a watershed with fertile soil. This is the case of many lakes and ponds in the prairie region, where there is an abundance of shallow waterbodies that recycle their nutrients quickly.
Anthropogenic (cultural) eutrophication involves more rapid increases in aquatic productivity (Figure 24.1). This is most often caused by nutrient loading associated with sewage dumping or runoff contaminated by agricultural fertilizer. Wherever humans live in dense populations or engage in intensive agriculture, there are large inputs of nutrients into lakes and rivers. In coastal areas, estuaries and shallow near-shore areas may also be affected by anthropogenic nutrient inputs and eutrophication.

Figure 24.1. Cultural Eutrophication in a Coastal Habitat. Rapid inputs of nutrients, especially nitrogen and phosphorus, can cause algal blooms, which ultimately lead to organic matter decomposition and oxygen depletion of shallow aquatic environments. Source: “Scheme of Eutrophication” by Hans Hillaewart licensed under CC BY-SA 3.0.
A theory called the Principle of Limiting Factors states that certain ecological processes are controlled by whichever environmental factor is present in the least supply relative to demand. According to this idea, the primary production of waterbodies is limited by the nutrient that is present in least supply relative to its demand (assuming that light, temperature, and oxygen supply are all adequate). Research has shown that, in almost all fresh waters, primary production is limited by the availability of phosphorus, occurring as the phosphate ion (PO43–). In contrast, marine waters are usually limited by the availability of inorganic nitrogen, particularly in the form of nitrate (NO3–).
Phosphorus as the Limiting Nutrient
During the 1960s and early 1970s, eutrophication was a topic of intense environmental controversy, part of which focused on the question of which nutrients were the limiting factors to primary production in lakes. Many scientists believed that phosphorus was most important in this regard. Others, however, suggested that dissolved nitrogen, in the form of nitrate or ammonium, was the critical limiting nutrient in many fresh waters. Plants and algae have relatively large demands for all of those nutrients, which typically occur in low concentrations in water.
It was also suggested that dissolved inorganic carbon (as bicarbonate, HCO3–) could be a limiting factor. Inorganic carbon is needed in large amounts by autotrophs, but in aquatic systems HCO3– is replenished mainly by the diffusion of atmospheric CO2 into the surface water, which is a slow process.
Eventually, research convincingly demonstrated that phosphorus is the key nutrient that limits primary production in most fresh waters. Consequently, controlling the rate of phosphorus supply is now known to be a crucial action if eutrophication is to be avoided.
The vital role of phosphorus is suggested in Table 24.1, which shows its typical concentration in fresh water (an index of supply) and its concentration in plants (an index of demand). Because the ratio of demand to supply for phosphorus is considerably larger than for other nutrients, it is a likely candidate to be the primary limiting factor for the productivity of algae and plants. The data also suggest that the next-most important nutrient is inorganic nitrogen, in the form of nitrate or ammonium.
Table 24.1. Demand and Supply of Essential Nutrients in Water. These are indexed by the typical concentrations in freshwater plants and in fresh water. Source: Data from Vallentyne (1974).
|
Nutrient |
Plants (%) |
Water (%) |
Ratio Plants:Water |
|
Carbon |
45 |
0.012 |
3,750 |
|
Silicon |
1.3 |
0.00065 |
2,000 |
|
Nitrogen |
0.7 |
0.000023 |
30,000 |
|
Potassium |
0.3 |
0.00023 |
1,300 |
|
Phosphorus |
0.08 |
0.000001 |
80,000 |
Other studies confirm that phosphorus is the usual controlling nutrient for eutrophication. Perhaps the most convincing data come from a famous series of experiments conducted in the Experimental Lakes Area (ELA; see Canadian Focus 24.1). Most of the research at the ELA involved the addition of nutrients at various rates and in different combinations to selected lakes, followed by monitoring of the ecological responses. The most important whole-lake experiments were the following (Schindler, 1978, 1990; Levine and Schindler, 1989):
- For two years, Lake 304 was fertilized with phosphorus, nitrogen, and carbon. It responded by becoming eutrophic. After the addition of phosphorus was stopped, the lake returned to its original oligotrophic condition, even though nitrogen and carbon were still being added.
- The two basins of Lake 226, an hourglass-shaped lake, were isolated with a vinyl curtain. One basin was fertilized with carbon, nitrogen, and phosphorus in a weight ratio of 10:5:1, while the other received only carbon and nitrogen at 10:5. Only the basin receiving phosphorus developed algal blooms. After five years, the nutrient additions were stopped, and the original oligotrophic condition returned within just one year. A similarly rapid recovery was observed in another experiment, involving Lake 303, after fertilization with P was stopped.
- Lake 302N was fertilized with phosphorus, nitrogen, and carbon. However, the nutrients were injected directly into deep water during the summer, at a time when lakes develop a thermal stratification (see In Detail 24.1). Because the nutrients were injected deeply, primary production in the surface water was not affected and eutrophication did not occur. Research at the ELA also showed that when phosphorus was added to lakes, the supply of nitrogen and carbon already present was capable of supporting phosphorus-induced eutrophication. In part, this occurred because eutrophication induced an increased rate of fixation of atmospheric dinitrogen (N2) by blue-green bacteria and a faster diffusion of atmospheric CO2 into the lake water.
Eutrophication also causes pronounced changes to occur in the species composition, relative abundance, and biomass of phytoplankton, which are the most important primary producers in the ELA lakes. Changes in the phytoplankton resulted in effects on organisms at higher levels of the food web, such as zooplankton and fish. For example, the productivity of whitefish (Coregonus clupeaformis) in hourglass-shaped Lake 226 was greater in the eutrophied basin than in the oligotrophic one. This occurred in response to the greater abundance of their prey of zooplankton and aquatic insects, which itself a trophic response to increased algae productivity.
In Detail 24.1. Lake Stratification
During most of the year, lakes have a rather uniform distribution of temperature throughout their depth. This allows their bottom and surface waters to mix easily under the influence of strong winds. During the summer, however, lakes often develop a persistent stratified condition (Figure 24.2). This is characterized by a surface layer of relatively warm water, several meters thick in most lakes (but thicker in some large lakes), lying above deeper, cooler water. Because the density of warm water is less than that of cool water, the two layers remain discrete and do not mix.

Figure 24.2. Lake Stratification. This figure depicts a seasonal cycle of thermal stratification with two periods of mixing in the spring and fall. Lakes with two mixing periods are called dimictic. Source: “Dimitic lake” by Turbidity.toronto is licensed under CC BY-SA 4.0.
The relatively warm, upper water of a stratified lake is known as the epilimnion, while the cooler, deeper water is the hypolimnion. These layers are separated by a narrow zone of rapid change, known as the thermocline. During the autumn, as the epilimnion cools, the stratification diminishes and the two layers become mixed by strong winds.
During stratification, oxygen and other dissolved substances can enter the hypolimnion, but mainly by diffusion across the thermocline. Because diffusion is a slow process, hypolimnetic oxygen becomes depleted in stratified lakes whose deeper water receives large inputs of organic material. The organic input may be associated with sewage, agricultural runoff, or algal biomass sinking from the epilimnion. The development of anoxic (no oxygen) conditions represents an important degradation of water quality because fish and most other animals cannot live in such an environment.
Sometimes, density gradients associated with dissolved salts may also cause lakes to become stratified. In these cases, a surface layer of fresh water sits on top of more saline, deeper water, with the layers separated by a steep chemical and density gradient known as a halocline.
Canadian Focus 24.1. The Experimental Lakes Area
Some of the most famous Canadian research in ecology and environmental science has been conducted in the Experimental Lakes Area (ELA) (Image 24.1). Research at the ELA, funded mainly by the Federal Department of Fisheries and Oceans (DFO), began during the late 1960s. The first two decades of work are closely identified with David Schindler, but hundreds of other Canadian and international scientists from governments and universities have been involved in research in the area. Several of the leading scientists working at the ELA, notably Schindler, have won international awards for their outstanding contributions.
The ELA is located in a remote region of northwestern Ontario near Kenora. The area contains many lakes and wetlands. The watersheds are largely forested, with thin soil that overlies hard quartzitic bedrock of the Canadian Shield. The ELA is not a protected area, so forestry is pursued, as are mining exploration and tourism. However, there is an understanding among the various interests in the ELA that some of the lakes and their watersheds are being used for research and should not be disturbed.

Image 24.1. Lake 226 in the Experimental Lakes Area. This lake was divided into two separate basins with a heavy vinyl curtain. The upper basin in the photograph was fertilized with phosphorus, nitrogen, and carbon, while the lower one received nitrogen and carbon. Only the basin that received phosphorus became eutrophic and developed blooms of phytoplankton, which are discernible as a whitish hue in the photo. Source: Michael Paterson.
One of the most important experimental procedures used at the ELA has been the controlled perturbation of entire lakes or wetlands. This is done to investigate the ecological effects of certain anthropogenic stressors, such as eutrophication, acidification, metal pollution, and flooding of wetlands. These are known as whole-lake experiments (and some as whole-wetland experiments). The experimental procedure includes an initial study of the lake or wetland for several years to determine the baseline conditions. The system is then perturbed in some way, for example, by causing it to become eutrophic by adding nutrients. The experimental lakes are monitored for a range of ecological responses, such as changes in the abundance and productivity of species and communities, in nutrient cycling, and in chemical and physical factors.
The experimental lakes are paired with reference (non-perturbed) ones, which provide information on natural changes that are unrelated to the manipulation. Because the reference lakes are monitored for a long time, they also provide extremely useful information relevant to changes in the ambient environment, such as climate warming.
Unfortunately, research at the ELA has been periodically threatened by cutbacks in funding, and the future of this world-class facility and its programs has been subjected to bouts of uncertainty. Throughout the history of the ELA, the DFO provided most of the funding to maintain its research infrastructure. Most of the experiments were also funded by DFO and conducted by its personnel or by university scientists working with them. However, during the early 1990s, DFO focused its activities more so on marine issues, and for several years it looked as if cutbacks might result in the ELA facility closing down. In fact, despite an international outcry from aquatic scientists and environmentalists, the ELA was essentially closed for about a year. During that time several buildings were taken down and extremely important research projects were curtailed or abandoned. Fortunately, however, the provinces of Ontario and Manitoba provided funding that has allowed the International Institute for Sustainable Development to manage and operate the ELA facility, so this vital location for whole-ecosystem science is now operating again to support world-class ecological research.
Sources of Nutrient Loading
In North America, eutrophication was most severe as an environmental problem during the 1960s and 1970s. At that time, the average discharge of phosphorus to inland waters was about 2 kg/person•year. About 84% of the phosphorus loading was associated with the dumping of municipal sewage, and the rest was due to agricultural fertilizer and sewage (from livestock). In addition, the nitrogen discharge at the time was about 12.5 kg/person•year, of which 36% was from municipal and 64% from agricultural sources.
Because scientists have convincingly demonstrated that phosphorus is the primary limiting nutrient for eutrophication in fresh water, control strategies have focused on reducing the input of that nutrient to surface waters.
Phosphorus in Detergent
One of the first targets was domestic detergents. During the 1960s and early 1970s, detergents contained large amounts of sodium tripolyphosphate (STP), which typically accounted for 50-65% of the weight of the product (12-16% as phosphorus). The STP was added as a so-called “builder” to reduce the activity of calcium and other cations in the wash water, thereby allowing the cleaning agents in the detergent (the surfactants) to work more efficiently. During the 1960s and early 1970s, as much as 3-million kilograms of high-phosphate detergents were used in North America each year, and virtually all was eventually flushed into surface waters through the sewage system. Detergent use accounted for about half of the phosphorus content of wastewater discharges during the early 1970s.
Fortunately, the domestic use of detergent is a discrete activity, and good substitutes are available to replace STP in the builder function. Consequently, it was relatively easy to achieve a rapid decrease in phosphorus loading by regulating the use of high-phosphate detergent. In 1970, detergents sold in the U.S. could contain as much as 8.7% phosphorus, a limit that was voluntarily agreed upon by the detergent industry. Several states began implementing their own legislation to limit phosphorus in detergent, and some areas have already banned the sale and use of detergents containing any phosphorus.
Sewage Treatment
Each year, over a billion tons of livestock manure is produced in the U.S. In 2017, the total production of manure was estimated to have a phosphorus content of 2.3 Tg and nitrogen content of 7.4 Tg (Bian et al., 2020). Not much of the livestock manure is treated before being released to the environment – it is mostly disposed onto fields or into a nearby waterbody. Around 90% of domestic wastewater in the U.S. is treated before it is released into the environment and about 33 billion gallons of municipal wastewater is treated per day (see Chapter 28 for notable exceptions).
In most places, the principal objectives of sewage treatment are to reduce inputs of pathogenic microorganisms and oxygen-consuming organic matter to receiving waters. However, in places where surface waters are vulnerable to eutrophication, sewage may also be treated to reduce the quantity of phosphorus in the effluent.
All sizeable towns and cities in the U.S. have facilities to collect the sewage effluent from homes, businesses, institutions, and factories. This infrastructure consists of complex webs of underground sewage pipes and other collection devices. Some municipalities have separate systems to collect domestic and industrial wastes, because the latter often contains toxic and hazardous chemicals that should be treated separately. Some municipalities also have a separate system to handle the large volumes of storm flows, which result from the runoff of rain and snow meltwater. Eventually, these large quantities of wastewater must be discharged into the ambient environment, usually into a nearby lake, river, or ocean. Wherever possible, it is highly desirable, and environmentally responsible, to treat the wastewater to reduce its pollutant load before discharging it into an aquatic ecosystem.
Regrettably, however, many municipalities in the U.S. have outdated sewer systems which can suffer from overflows, polluting surrounding areas. These combined sewer systems (CSS) collect stormwater runoff, sewage, and industrial waste, delivering the combined wastewater to sewage plants for treatment. Heavy rainfall or snowmelt can cause a CSS to overflow, resulting in a combined sewer overflow (CSO). This overflow of untreated wastewater will dispel into nearby rivers, streams, lakes, or any nearby waterways, polluting these bodies of water with harmful chemicals. The U.S. Environmental Protection Agency estimates that per year over 850 billion gallons of CSO is discharged nationwide. The Northeast and the Great Lakes Basin have the highest concentration of CSSs in the U.S. (including Binghamton, NY), and CSSs occurring in cities such as Detroit, Cleveland, Buffalo and Toledo are detrimental to water quality and human health around the Great Lakes. Larger cities, including New York City, Chicago, and Philadelphia also have CSSs, posing a threat to water quality and safety (EPA, 2004).
Compared with many oceanic environments, inland waters such as lakes and rivers have a much smaller capacity for diluting and biodegrading sewage waste. Consequently, most municipalities located beside an inland waterbody treat their sewage before discharging the effluent. Sewage treatment can, however, vary greatly in degree and in the technology used, as we examine below (Freedman, 1995).
- Primary sewage treatment is relatively simple. It usually involves the screening of raw sewage to remove larger materials, and then allowing the remainder to settle to reduce the amount of suspended organic matter. The resulting effluent is then discharged into the environment, although it may first be treated with a disinfectant (usually a chlorine compound) to kill pathogens, especially bacteria. Primary treatment typically removes 40-60% of the suspended solids of raw sewage and 5-15% of the phosphorus, while reducing the biological oxygen demand (BOD) by 25-40%. (BOD is the capacity of the organic material in wastewater to consume oxygen during decomposition.) More advanced primary systems can reduce the suspended solids by 90% and the BOD by 50%. In addition, they can reduce fecal coliforms by 45-55%.
- Secondary sewage treatment may be applied to the effluent of primary treatment, mostly to further reduce the BOD. Secondary treatment usually involves the use of a biological technology that enhances aerobic decomposition of organic waste by stimulating the microbial community in an engineered environment. Two such biotechnologies in common use are (1) activated sludge, which involves a vigorous aeration of sewage water to enhance the decomposition of its organic content, and (2) trickling filters, in which the wastewater passes slowly through a complex physical matrix that supports a large population of microorganisms. These biotechnologies, along with primary treatment, produce large quantities of a humus-like product known as sludge, which can be composted and then spread onto agricultural land as an organic-rich conditioner. Sludge may also be less-usefully incinerated or dumped in a landfill. Primary and secondary treatments together remove 30-50% of the phosphorus from sewage and reduce the BOD and suspended solids by 85-90% and coliforms by 90-99%.
- Tertiary sewage treatment includes processes to remove most of the remaining dissolved nutrients from the effluent. Phosphorus removal may be achieved by adding aluminum, iron, calcium, or other chemicals that develop insoluble precipitates with phosphate, which then settle out of the water, removing 90% or more of the phosphorus. Other tertiary processes may be used to remove ammonium and nitrate.
- Artificial wetlands are sometimes constructed to provide advanced treatment of sewage. The wetlands are engineered to develop a highly productive ecosystem, in which vigorous microbial activity decomposes organic waste while algae and macrophytes decrease nutrient concentrations in the water. Most sewage-treatment wetlands are constructed outdoors, but some are developed inside of a greenhouse, which allows the system to work during the winter. The efficiency of these systems depends on climate, the rate of flow-through of the sewage, and the nature of the engineered wetland. Typically, artificial wetlands remove up to 30% of the phosphorus from raw sewage, while reducing BOD by as much as 90%.
Tertiary treatment to reduce phosphorus in municipal effluents requires expensive investments in technology and operating costs. Consequently, this practice is pursued only under certain conditions. Tertiary treatment is mostly used by communities located beside rivers and around the Great Lakes. Moreover, because the Great Lakes are affected by effluents originating from sources in both Canada and the U.S., bilateral agreements have been negotiated concerning the loading of phosphorus and other pollutants. To meet the target loadings, municipalities in both countries must use tertiary systems to achieve a high degree of phosphorus removal from sewage.
Elsewhere, less attention is generally paid to the removal of phosphorus from municipal effluents. Although municipalities may treat their sewage, only primary or secondary systems are generally used, mostly to reduce the abundance of pathogens and to lower BOD in the effluent (Chapter 28).
As previously noted, agricultural livestock produce enormous amounts of fecal materials. However, their manure is rarely treated before it is disposed into the environment. Treatment facilities for agricultural sewage are considered too expensive and are not often required by regulators. This happens even though some intensive rearing facilities, such as agro-industrial feedlots and factory farms, may produce huge amounts of concentrated manure, equivalent to the sewage of a small city.
Eutrophication of an Arctic Lake
Meretta and Char Lakes are two small lakes that are located on Cornwallis Island in northern Canada. Because of the severe climate in the High Arctic, tundra lakes are relatively simple ecosystems. Moreover, nutrient inputs are sparse and cycling is slow, so tundra lakes are naturally oligotrophic. Char Lake is a typical oligotrophic, polar lake, with extremely clear water and low rates of productivity of algae, zooplankton, and fish. Meretta Lake, in contrast, received sewage from a small community. Because of the nutrient input, it became moderately eutrophic (Schindler et al., 1974).
The sewage dumping resulted in phosphorus loading about 13 times larger in Meretta than in Char Lake, while the nitrogen input was 19 times higher. Consequently, during the growing season, Meretta Lake developed a phytoplankton biomass averaging 12-times greater than in Char, and up to 40-times higher during the summer algal bloom. In the winter, these lakes are covered with ice, which restricts the rate at which atmospheric oxygen can enter the water. During this time, the decomposition of organic material, mostly sewage waste but also algal biomass, exerts a great demand for oxygen in the bottom water of Meretta Lake, resulting in anoxic conditions. The oxygen depletion causes severe stress to aquatic animals and impairs the reproduction of Arctic char (Salvelinus alpinus), a type of trout.
This case demonstrates that even polar lakes, which are relatively simple ecosystems because of their severe climatic environment, can exhibit a strong eutrophication response to fertilization with limiting nutrients.
Lake Erie: Eutrophication and Other Stressors
The Great Lakes are one of the world’s outstanding freshwater systems, holding about one-fifth of global surface fresh water (excluding glaciers). Lake Superior sits at the top of this chain, with Lakes Michigan, Huron, Erie, and Ontario located below (Image 24.2). The lakes and their watersheds drain to the Atlantic Ocean through the St. Lawrence River, itself a great waterway (there is also some flow to the Mississippi River, through a canal in Chicago). The aggregate surface area of the Great Lakes is 245-thousand km2, and the watershed is 539-thousand km2 (Table 24.2). About 35 million people live in the watershed, of which 25 million are in the U.S.

Image 24.2. The Great Lakes from Space. This is a satellite image of the Great Lakes from space. Lake Superior is in the top left with Lake Michigan directly below. To the right of Lake Michigan is Lake Huron with Lake Erie below. Lake Ontario is above and to the right of Lake Erie. Source: NASA.
All of the Great Lakes except Lake Michigan form part of the border between Canada and the United States. Consequently, issues concerning resources and water quality are binational: waters in Canadian jurisdiction are affected by actions in the U.S. and vice versa. Especially important issues are the dumping of sewage and industrial waste, the conversion of forest and wetlands into agricultural and residential land-uses, and commercial and sport fishing. Recognizing this context, the governments of Canada and the U.S. have entered into a number of co-operative agreements regarding the management of resources, emissions of pollutants, and research and monitoring of their shared Great Lakes ecosystem. Much of the integrated binational activity is coordinated by the International Joint Commission, a body with equal representation from both countries. The Great Lakes Water Quality Agreement, implemented in 1972 and modified in 1978, 1983, 1989, and 2012, commits Canada and the U.S. to maintain and restore the chemical, physical, and ecological integrity of the Great Lakes and their watershed.
Lake Erie has a relatively small volume and is located in a watershed with fertile soil. Consequently, Lake Erie has always been the most productive of the Great Lakes. However, its productivity has been greatly increased as a result of nutrient inputs associated with urban sewage and agricultural drainage. This has created eutrophic conditions in shallower regions of the lake. The western basin of Lake Erie is particularly vulnerable to eutrophication because it is relatively shallow and warm and receives large inputs of sewage and agricultural runoff. In addition to nutrient loading, Lake Erie has been affected by other important stressors. These include contamination by potentially toxic chemicals, large commercial and recreational fisheries, conversion of most of the natural ecosystems in its watershed into agricultural and urban land-uses, and introductions of alien plants and animals. This complex of stressors has degraded the water quality and ecosystem of Lake Erie. The damage was particularly acute during the late 1960s and early 1970s, when pollution was relatively uncontrolled. Although some of the earlier problems have been alleviated, Lake Erie is still in a degraded condition. The following sections examine the most important ecological changes in Lake Erie, as a case study of the effects of eutrophication occurring in combination with other stressors (Freedman, 1995).
Table 24.2. Size and Watershed Characteristics of the Great Lakes of North America. Sources: Data from Environmental Protection Agency (2007, 2020).
Superior |
Michigan |
Huron |
Erie |
Ontario |
|
Surface area (mi²) |
31,700 |
22,406 |
23,012 |
9,940 |
7,320 |
Average depth (ft) |
483 |
279 |
195 |
62 |
283 |
Maximum depth |
1,332 |
925 |
750 |
210 |
802 |
Land Drainage Area (mi²) |
49,300 |
45,600 |
51,700 |
30,140 |
24,720 |
Retention time (years) |
191 |
99 |
22 |
2.6 |
6 |
Total watershed area (ha) |
4,226,924 |
11,702,442 |
4,114,697 |
5,559,238 (including St. Clair) |
3,428,229 |
Oxygen Depletion
Lake Erie develops a stratified condition during the summer, making it difficult for oxygen to penetrate to deep-water habitat (see In Detail 24.1). If the deeper water is subject to large demands for oxygen to decompose organic materials, deoxygenation can result. During most summers from the 1950s to 1970s, this condition occurred widely in Lake Erie, especially in its shallow western end. Sewage dumping and algal biomass sinking from the surface water resulted in an intense demand for oxygen, causing extensive deoxygenation of bottom water.
Deoxygenation is harmful to aquatic animals, most of which require free access to oxygen in order to live. The episodes of anoxia in Lake Erie caused great changes to occur in the community of invertebrates living in the sediment (benthos). The benthic community was dominated by larvae of mayflies (aquatic insects in the order Ephemeroptera). The most common species were Hexagenia rigida and H. limbata, which lived in surface mud in an abundance of about 400/m2. However, following a series of severe oxygen depletions in the 1950s, these insects decreased to about 40/m2, and by 1961 they had almost disappeared, occurring at less than 1/m2.
The collapse of benthic mayflies was widely reported by the popular media, which sensationalized the phenomenon by suggesting that Lake Erie was “dead.” This was by no means the case, because the mayflies had been replaced by a benthic fauna that is tolerant of deoxygenation. These included aquatic worms known as tubificids (Limnodrilus spp.), insect larvae of the midge family (order Diptera, family Chironomidae), and small molluscs (snails in the order Gastropoda and clams in the family Sphaeriidae). The worm-dominated benthos, however, is considered an indication of great degradation of ecological integrity compared with the mayfly-dominated community of well-oxygenated sediment.
Algal Blooms
Because Lake Erie has a greater supply of nutrients, it supports a much larger biomass of phytoplankton than the other Great Lakes. When its eutrophication was most severe, its western basin supported about twice as much algal biomass as Lake Ontario (per unit of surface area), and 11 times more than oligotrophic Lake Superior.
The communities of phytoplankton vary greatly among the sub-basins of Lake Erie and also between its nearshore and offshore waters. The eastern and central basins are relatively deep and unproductive, while the shallower western basin is more productive. In all three basins, however, shallow nearshore habitat is more productive than offshore water. The algal bloom that occurs during the spring in eutrophic water is typically dominated by diatoms of the genus Melosira, while the bloom in late summer is dominated by the blue-green bacteria Anabaena, Microcystis, and Aphanizomenon, the diatom Fragilaria, and the green alga Pediastrum.
In addition, the colonial green alga Cladophora glomerata can occur as filamentous mats attached to rocks in shallow habitats. This alga grows in locally fertile habitats in Lake Erie and some of the other Great Lakes. It was especially abundant during the 1960s and 1970s, when storms caused mats of its biomass to detach from rocky substrates, eventually washing ashore as a malodorous mass or sinking to deeper water to contribute to the development of anoxic conditions.
Studies have shown that the western basin of Lake Erie has always been relatively productive, sustaining a lush growth of aquatic plants and algae and large populations of fish. However, the huge nutrient inputs associated with sewage dumping and agricultural runoff increased the intensity of eutrophication. Fortunately, these problems have been alleviated substantially since the 1970s. This is because inputs of phosphorus to the lake have decreased, mainly through a ban on high-phosphate detergent and the construction of tertiary sewage-treatment plants to service cities and towns.
Changes in Zooplankton
The zooplankton of Lake Erie used to be dominated by relatively large species, such as Limnocalanus macrurus and species of Daphnia. By the 1960s, however, these had mainly been replaced by smaller, previously rare species, such as Diaptomus siciloides, which is considered to be an indicator of eutrophic conditions. The greatest changes occurred in the shallow western basin, where the midsummer zooplankton density increased from less than about 7-thousand/m3 prior to 1940, to as much as 110-thousand/m3 in 1959. However, even at that time, zooplankton species typical of oligotrophic conditions survived in the deeper eastern basin.
Changes in the zooplankton community were caused partly by the increasing primary productivity, because single-celled phytoplankton are the food-base of these tiny crustaceans. In addition, at about the same time that Lake Erie was becoming more eutrophic, its commercial fishery was over-exploiting larger species of fish, which are typically piscivorous (they eat other fish). After the demise of the piscivorous species, the fish community became dominated by smaller species that feed on zooplankton (known as planktivorous fish), which selectively feed on larger zooplankton. Therefore, smaller species of zooplankton were favored and their abundance increased.
Changes in the Fishery
Lake Erie has long supported a large fishery, which typically exceeds the combined landings of all the other Great Lakes. Remarkably, the total catch by the commercial fishery has been quite stable over the years. This has occurred despite enormous changes in the species of fish present, fishing technology, intensity of eutrophication, pollution by toxic chemicals, habitat damage caused by damming rivers required for spawning, and sedimentation of shallow habitat by soil eroded from deforested parts of the watershed.
Although the catch of the fishery on Lake Erie has not declined, the nature of the fish community has changed greatly. These changes illustrate a severe degradation of the fishery resource and of the natural ecosystem. When the commercial fishery on Lake Erie began in the nineteenth century, the prime targets were the largest, most valuable species – these were whitefish (Coregonus clupeaformis), lake trout (Salvelinus namaycush), and herring (Leucichthys artedi). This is a common pattern whenever a previously unexploited fishery or forest resource is initially harvested – take the best and leave the rest (see Chapter 12).
Unfortunately, populations of the most desirable species were rapidly depleted. This happened because the fishing pressure was excessive and could not be sustained. Also, severe habitat degradation occurred in the lake, caused mainly by erosion and siltation associated with extensive deforestation of its watershed. As the most desirable species disappeared, the fishing industry switched to “second-choice” species, such as blue pike (Stizostedion vitreum glaucum), walleye (S. v. vitreum), sauger (S. canadense), and yellow perch (Perca flavescens). Because of over-exploitation and habitat degradation, the species of Stizostedion became extirpated or rare by the early 1970s. The fishery was then dominated by smaller, low-value species such as yellow perch, and by alien fish such as rainbow smelt (Osmerus mordax), freshwater drum (Aplodinotus grunniens), and carp (Cyprinus carpio). Therefore, although the total yield of fish caught has remained fairly large and consistent over time, the quality of the economic resource and the integrity of the fish community have been badly degraded.
Recent Changes in Environmental Quality
For a number of reasons, ecological conditions have improved markedly in Lake Erie since the late 1970s. This has largely been achieved by the construction of sewage-treatment facilities in lakeside cities and towns in Canada and the U.S. (as well as upstream, especially on the Detroit River and Lake St. Clair). Many of these facilities include technology to reduce phosphorus inputs. The annual loading of phosphorus to Lake Erie has been reduced from about 28-thousand metric tons in 1968, to 20-thousand t in 1974, and 6-17-thousand t during 1981-2008 (average 9-thousand t; Richards, 2012). Whereas in the 1960s most of the phosphorus loading was from point-sources (primarily discharges of sewage from towns and cities), it is now mostly non-point discharges associated with agricultural runoff.
The reduction of phosphorus input has alleviated eutrophication in Lake Erie (Makarewicz and Bertram, 1991). The average biomass of phytoplankton decreased from 3.4 g/m3 in 1970 to 1.2 g/m3 during 1983-1985. The largest biomass still occurs in the western basin, where it averaged 1.9 g/m3 during 1983-1987, compared with 1.0 g/m3 in the central basin and 0.6 g/m3 in the deepest, eastern basin. Blooms of nuisance algae have also decreased in intensity. For example, the blue-green alga Aphanizomenon flos-aquae had a standing crop as high as 2.0 g/m3 in 1970, but only 0.22 g/m3 during 1983-1985. Similarly, diatoms that indicate eutrophic conditions have decreased in abundance, by 85% in the case of Stephanodiscus binderanus in the western basin, and by 94% for Fragilaria capucina. At the same time, diatoms indicative of mesotrophic or oligotrophic conditions have become more abundant, notably Asterionella formosa and Rhizosolenia eriensis. The open water of the previously eutrophic western basin is now considered to be in a mesotrophic condition, while the eastern basin is now oligotrophic. Figure 24.3 depicts the reduction of phytoplankton due to the introduction of zebra mussels in the late 1980s.

Figure 24.3. Phytoplankton Density in Lake Erie. This figure shows how filter-feeding on phytoplankton by zebra mussels has helped to clarify the water of Lake Erie (along with the influence of reduced phosphorus loading). The sampling site at Union is at the western end of the lake, while Blenheim and Elgin are progressively east. The zebra mussel invaded from west to east, and there was a lag in the development of its dense shoals along this gradient. Source: Modified from Edsall and Charlton (1997).
The animal communities have also changed since the 1970s. Species of zooplankton that indicate oligotrophic conditions have become more abundant, while indicators of eutrophication are fewer and mostly restricted to the western basin. Since 1972, the populations of relatively large fishes have increased greatly, particularly walleye and introduced Pacific salmon (Oncorhynchus spp.). These are fish-eating species, and their predation has decreased the abundance of smaller, zooplankton-eating fish such as smelt, alewife (Alosa pseudoharengus), and shiners (Notropis spp.). The decrease of planktivorous fishes has allowed secondary increases of larger-bodied zooplankton, such as the waterflea Daphnia pulicaria.
The zebra mussel (Dreissena polymorpha) is another cause of important ecological change. This bivalve mollusk, a native of Eurasia, was accidentally introduced to the Great Lakes by the discharge of ballast water from transoceanic ships. The mussel can rapidly attain an extremely dense population (up to 50,000/m2) on hard underwater surfaces such as rock, metal, and concrete (Image 24.3). It is a filter-feeder, and its huge populations have an enormous capability for removing algal cells from water. Consequently, they may be responsible for some of the recent clarification of Lake Erie and eutrophic parts of other Great Lakes (Figure 24.3). In addition, their dense populations have benefited some species of ducks that winter on the lakes and feed on benthic mollusks and other invertebrates. However, the invasion of the Great Lakes by zebra mussels has also caused serious damage, including a reduction in filter-feeding zooplankton (with secondary effects on planktivorous fish), and the displacement of native mollusks that cannot compete with the dense shoals of this non-native mussel. Industries and water utilities have also suffered damage from the clogging of their water-intake pipes.

Image 24.3. Zebra Mussels on Boat Propeller. Zebra mussels are an invasive species that can attach and form dense populations on hard surfaces. Depicted is a boat propeller from Lewis and Clarke Lake in South Dakota. Source: “Zebra Mussels on Boat Propeller” by Sam Stukel, USFWS Mountain-Prairie, is licensed under CC0 1.0.
Overview of the Lake Erie Case Study
Lake Erie is an important example of the cumulative, detrimental effects of a variety of anthropogenic stressors on the ecological health of a large lake. The stressors that have degraded Lake Erie include eutrophication caused by nutrient loading, habitat damage through siltation resulting from deforestation of the watershed, over-exploitation of a potentially renewable fishery, pollution by oxygen-consuming sewage and toxic chemicals, and introductions of alien species. Fortunately, Lake Erie is also beginning to demonstrate that a highly degraded ecosystem can be induced to recover somewhat, assuming that the causes of the damage can be mitigated effectively. Still, there is much that should yet be done to improve environmental conditions in Lake Erie and the other Great Lakes, particularly with respect to the continued dumping of incompletely treated and even raw sewage.
Dams and Impoundments
A dam is a structure that is used to contain flowing water, which backs up to form a lake-like impoundment. Some dams are immense. The world’s first “very large” dam was the 221 m Hoover Dam, built in 1935. The tallest is the Jinping-I Dam at 305 m, on the Yalong River in China. Dams may be built for various useful purposes: as components of a hydroelectric development, as a flood-control structure, and to store water for use in irrigated agriculture or to supply municipal water. The International Commission on Large Dams (2014) reports that there are 58.3-thousand dams taller than 15 m in the world (these are referred to as “large dams”), and perhaps 800-thousand shorter ones. About 49% of the dams have a single use, of which 49% are for irrigation, 20% for hydroelectricity, 13% for municipal water supply, 9% for flood control, and 10% for other purposes. Of the multi-use dams, 24% are for irrigation, 19% for flood control, 17% for municipal water supply, 16% for hydroelectricity, 12% for recreation, and 12% for other purposes.
The U.S. has over 90,000 dams, and around 6,300 of these are large dams (>15 m). About 32% of the dams are primarily used for recreation, 17% for flood control, and 3% for hydroelectricity. Other purposes include irrigation, municipal water supply, and waste storage (American Society of Civil Engineers, 2021).
The construction of dams and impoundments always causes environmental damage and affects local people in various ways. For these reasons, these developments are always controversial at the local scale, and often at national and international levels as well. Such controversy has been sufficient to halt some proposals (often in concert with concerns about economic and energy-supply issues). A U.S. example of this is in the Columbia River Basin, which has many controversial dams. The Yakama and Lummi nations, two indigenous tribes of the Pacific Northwest, have petitioned to have dams on the Lower Snake River, a tributary of the Columbia River, removed because they have decimated traditional fishing activities. Salmon migration has been impeded by dams in the Columbia River Basin, negatively impacting the livelihood of many indigenous peoples. However, because these dams provide hydroelectric power to Oregon, Washington, and Idaho, pleas for their removal by indigenous people and environmental activists have been largely ignored (Flaccus, 2019). Mostly over the last two decades, more than 1,200 dams have been removed in the U.S. in hopes of restoring the integrity of river ecosystems (Bellmore et al., 2017; Figure 24.4).

Figure 24.4. Total Number of Dams (a) and Dams Removed (b) in the United States. Source: Bellmore et al. (2017).
Moreover, if today’s criteria for acceptable environmental and socio-economic impacts had been applied to earlier proposals, many of the existing dams and impoundments would not have been constructed. For example, the World Bank has progressively upgraded its environmental and socio-economic criteria for funding large dam projects. In 1996, it re-evaluated proposals it had considered during the period of 1960 to 1995 (Dorcey et al., 1997) and found that under the older evaluation criteria, about 10% of the proposals had been considered “unacceptable” for funding. Under the new criteria, however, 26% would have been considered unacceptable and another 48% only “potentially acceptable” (the latter could become acceptable if modified to take account of certain environmental and/or socio-economic concerns).
In the next sections we examine the most important environmental effects of dams and impoundments, with an emphasis on those occurring in North America.
Hydroelectric Developments
Hydroelectricity is produced by using the kinetic energy of flowing water to turn a turbine, which connects to a generator that produces electricity, which is distributed to consumers through a complex network of transmission lines (see Chapter 18) (Image 24.4). The global use of hydroelectricity was 3,782 terawatt-hours of electricity in 2013; this is equivalent to 856 x 106 metric tons of oil (BP, 2015). About 56% of the global use of hydroelectricity occurs in developed countries, and 23% in North America. The U.S. is the third largest producer of hydroelectricity, after China and Brazil. Hydroelectricity accounts for about 6.6% of all commercial energy use in the U.S., and 38% of all renewable energy (others include wind, solar, geothermal, and biomass; BP, 2015).

Image 24.4. Robert Moses Niagara Power Plant. This hydroelectric generating station is located on the Niagara River in Lewiston, New York. It generates electricity mostly at night using river flow that has been diverted to a storage reservoir. During the day, however, the river flow passes over Niagara Falls, a popular tourist destination. Source: “Robert Moses Niagara Power Plant” by LindaDee2006 is licensed under CC BY-NC-ND 2.0.
There are three basic ways to harness flows of surface water to generate hydroelectricity:
- A large impoundment can accumulate river flow and flood an extensive area of land. This stores water from the spring high-flow period so that electricity can be generated according to demand throughout the year. This kind of facility has a large effect on the seasonal variation of below-dam river flow, because it greatly reduces the spring peak flow while increasing the flow during the summer, fall, and winter (Figure 24.5). Large impoundments are the most common type of major hydroelectric facility in the U.S.
- A run-of-the-river development directly harnesses the flow of a river to drive turbines, without creating a large impoundment for storage. This kind of facility utilizes river flow according to its seasonal availability. A run-of-the-river development has little or no capacity to store part of the spring peak flow, or to coordinate the timing of electricity generation with peaks of consumer demand. However, this kind of hydro development causes much less environmental damage than one involving a large reservoir.
- A combined system incorporates elements of both run-of-the-river and the development of a large impoundment. These so-called peaking systems will store water during part of the day and release it during the time of highest demand for electricity, which is generally between 08:00 and 22:00 (Figure 24.6). One variation is the pumped-storage system, in which electricity generated during low-demand times of the day is used to pump water into an elevated reservoir; the stored water is later used to generate electricity at the peak-demand time. If the peak-flow system causes large flow variations downriver, important ecological damage may be caused. Other combined systems have run-of-the-river generators installed on rivers draining into a central reservoir or installed downriver of a reservoir.

Figure 24.5. Effects of Reservoir Development on Seasonal Flow of the Peace River. The Bennett Dam and its associated reservoir were built in 1968, so the upper curves (for 1915–1967) represent pre-impoundment conditions. The flows were measured at the town of Peace River, Alberta, Canada. The most notable changes are (1) an overall reduction in the annual variation of river flow; (2) a large reduction in peak flow during mid-April to mid-July; and (3) an increase during the low-flow period of September to March. Source: Modified from Rosenberg et al. (1997)

Figure 24.6. Effects of Peaking Discharges on Hourly Mean Discharge to the Nelson River. The data are for a one-week period in July 1984. This figure illustrates the changes in hydrology that occur downstream if the generation of electricity is timed to meet the peak daily demand. Note the relatively low demand during the weekend. Kelsey Dam is not subject to these peaking discharges, so it represents the background pattern of low flow in the summer. Source: Modified from Rosenberg et al. (1997).
Environmental Effects
Important environmental benefits are associated with the use of hydroelectricity:
- Because the energy source (flowing water) is renewed through the hydrologic cycle, hydroelectricity is a renewable source of power.
- The emissions of greenhouse gases are much smaller than those associated with the use of fossil fuels to generate electricity.
- Unlike fossil fuels, there are no direct emissions of SO2 or NOx, which are important causes of acid rain.
- In some regions, impoundments help control downstream flooding, which might otherwise cause economic damage and risks to people living in flood plains (described later).
- Substantial recreational or commercial fisheries may develop in reservoirs.
However, to a degree these advantages are rather simplistic, particularly because large quantities of fossil fuels, metals, and other non-renewable resources are used to construct hydroelectric facilities. Moreover, the dams and impoundments cause some important environmental damages (Dorcey et al., 1997; Rosenberg et al., 1997; International Rivers n.d.).
- Flooding of Natural Habitat: Large reservoirs flood extensive areas of terrestrial and wetland habitat (Image 24.5). This causes ecological damage, including the displacement of plants and animals that had utilized the original habitats. In some cases, uncommon or rare species may be affected, particularly if unusual habitats such as waterfall spray zones or special wetlands are destroyed. Of course, even while flooding destroys terrestrial and wetland areas, it also develops new aquatic habitats, which provide opportunities for certain fish, waterfowl, and other aquatic species. The productivity of algae, zooplankton, and fish is usually relatively high for several years after the creation of a new reservoir because of nutrients leached from flooded soil.

Image 24.5. Hydroelectric developments in relatively flat terrain can result in the flooding of enormous areas as reservoirs. The McNary Dam on the Columbia River in Oregon, pictured above, created the Lake Wallula reservoir in 1954, which has a total surface area exceeding 38,000 acres. Source: “McNary Dam” by Bonneville Power is licensed under CC BY 2.0.
- Methylmercury: High concentrations of methylmercury commonly occur in fish in reservoirs. This happens because inorganic mercury that is naturally present in soil becomes methylated by bacteria under the anoxic conditions that develop in sediment after flooding. As we learned in Chapter 22, methylmercury is readily bioaccumulated by organisms and then magnifies up the food web to occur in particularly high concentrations in top predators. It also tends to occur in higher concentrations in older individuals within a fish population. Mercury concentrations in the flesh of predatory fish in reservoirs are often higher than 1.0 ppm and can reach 3 ppm, which significantly exceeds the 0.5 ppm limit for fish intended for human consumption. Fish with high concentrations of methylmercury are also a toxic hazard to natural predators such as osprey (Pandion haliaetus), bald eagle (Haliaeetus leucocephalus), and river otter (Lutra canadensis). Mercury pollution is common in man-made reservoirs in the United States (Figure 24.7). In general, this phenomenon is most intense in large, new reservoirs. It is less of a problem in reservoirs that are created by raising the water level of a steep-sided lake or river valley with shorter-term storage, or in older impoundments.

Figure 24.7. Map of Reservoirs in California Identified as Mercury Impaired, 2010. This map highlights 71 reservoirs throughout California that have been identified as mercury impaired, which the Clean Water Act describes as high levels of mercury, often in fish, that pose a threat to the ecosystem and or human health. Source: California State Water Resources Control Board (2017).
- Altered Flows and Obstructions: Many downstream effects result from the construction of dams, other flow-control structures, and diversions of rivers to increase the flow into reservoirs. Changes in the timing and amounts of flow affect the sedimentation regime: decreased flow results in silt deposition and the infilling of gravel beds used by spawning fish, while scouring by increased flow causes other kinds of habitat damage. Large changes in the flow also affect the productivity of algae and macrophytes, in part by affecting the flux of nutrients. These effects can be particularly acute in riverine marshes, deltas, and estuarine habitat. The resulting changes in productivity and other habitat characteristics may secondarily affect aquatic invertebrates, fish, migratory birds, and aquatic mammals.
- Effects of Obstructions: A high dam can be an insurmountable obstruction to the up-river passage of migratory fish. However, this blockage can sometimes be partially mitigated by installing a fish ladder, by catching migrating fish and transporting them above the dam, or by releasing young fish raised at a hatchery. In addition, juvenile fish migrating to the ocean may be killed or injured during passage through the turbines of a hydroelectric facility. Some of this damage can be avoided by installing screens or deflectors, while also providing an alternative passageway for the migrating fish.
- Emissions of Greenhouse Gases: The development of a large reservoir results in conditions suitable for the emission of large amounts of carbon dioxide and methane to the atmosphere (see Chapter 21). The production of methane, which is about 28 times more potent as a greenhouse gas than carbon dioxide, may occur if flooding results in anaerobic conditions through the decomposition of large amounts of biomass – the dead trees and litter of drowned forests and the organic matter of inundated wetlands, especially peaty bogs and fens. Such oxygen-poor conditions favor the production of methane during decomposition, which out-gasses into the atmosphere. The emission of greenhouse gases is greatest during the first several decades after flooding and then slows to a rate similar to that of natural lakes. Experimental flooding of a wetland at the Experimental Lakes Area resulted in a twenty-fold increase in the rate of methane emission to the atmosphere. Under conditions that are particularly favorable for methane generation, the rate of emission of greenhouse gases (standardized as greenhouse warming potential because CH4 has greater radiative activity than CO2) can exceed that of a coal-fired power plant (although this is more characteristic of tropical reservoirs than cooler ones; Rosenberg et al., 1997).
- Effects on Biodiversity: Some hydroelectric developments have destroyed the habitat of threatened species or unusual ecosystems. The proliferation of dams on rivers has greatly reduced or extirpated many populations of Atlantic salmon (Salmo salar) and Pacific salmon (Oncorhynchus spp.). At least 142 stocks of Pacific salmon in the Pacific Northwest have been lost partly because of hydroelectric dams (in combination with logging, over-fishing, and other stressors), and many others are threatened. In Washington, 14 species of salmon and steelhead are listed as being at risk of extinction under the Endangered Species Act (Washington State Recreation and Conservation Office, 2020). Undoubtedly, numerous undocumented losses of rare species and their habitat occurred during the construction of hydroelectric developments in the United States and elsewhere prior to the early 1970s, when biodiversity surveys became a routine component of environmental impact assessments for these projects.
- Effects on Local People: The lifestyle of local people can be greatly affected by a hydroelectric development. This is particularly true if a large reservoir is developed in a heavily populated area, which is often the case in less-developed countries. For example, in China alone, the Three Gorges Dam displaced about 1.3-million people; the Danjiangkou Dam (completed in 1974) displaced 383-thousand people; the Sanmenxia (1960), 319-thousand; the Xinjiang (1961), 306-thousand; and in India, the Dongpinghu Dam (1958) displaced 278-thousand people (Goodland, 1993). In such crowded countries, suitable land for relocation of these displaced people is often unavailable. People are also displaced by reservoirs in the United States, although typically several hundred or fewer. Almost all of the displaced people are indigenous, who may have to be relocated from traditionally used areas if their land becomes flooded. They are also deprived of opportunities to hunt mammals and birds in part of their traditional foraging area, and they may not be able to eat fish from the reservoir or downstream for several decades after its creation (because of health hazards associated with methylmercury). Of course, local economic opportunities exist for some of these people, such as jobs associated with the construction and maintenance of the hydro facility and its related infrastructure of transmission lines and roads. However, entry into wage employment can be extremely disruptive to traditional subsistence lifestyles, for both individuals and the community. There are also many social and economic disruptions caused by the influx of people from elsewhere and from the construction of new roads and towns. For these and other reasons, local people often bitterly resist the development of large hydroelectric facilities (and other large industrial projects) in the areas where they live.
U.S. Focus 24.1. Hydro Development in the Columbia River Basin.
Hydroelectric power is an economically attractive and renewable source of energy. In the past, areas with a high potential for hydroelectricity were often developed without much consultation with local people, who also may not have received many economic benefits from the project. Local people generally did, however, bear the brunt of the environmental damage, which typically included extensive flooding, changes in the hydrology of rivers used for transportation or for fishing, and sometimes harmful influences on traditional lifestyles and culture.
One example of intensive hydroelectric development is the Columbia Basin Project, an irrigation network in the State of Washington. The project was first authorized in the early 1930’s by President Franklin D. Roosevelt and then later reauthorized under the Columbia River Basin Project Act of 1943. It is now one of the largest water reclamation projects to have taken place in the U.S., supplying irrigation water to over 670,000 acres (2,700 km2) of the 1,100,000 acres (4,500 km2) large project area. One of the main features of this project is the Grand Coulee Dam, which cost nearly 2 billion dollars to build and was completed in 1942. The dam was constructed to control floods, regulate streams, and store and deliver water throughout the region (Bureau of Reclamation, 2020). After Grand Coulee Dam’s construction, additional smaller dams were built throughout the Columbia River Basin to assist with irrigation. Today, the hydroelectric power facility at Grand Coulee produces a great amount of power and generates over 21 TWh of electricity annually (Pitzer, 1994).
This project was highly controversial among environmentalists and indigenous people who lived in the region. The Colville Confederated and Spokane native tribes had settlements within the proposed area for the Franklin Delano Roosevelt Lake reservoir (which formed as a result of dam construction) and were offered small payments for the lands and forced to leave. Over 3,000 Native Americans were displaced because of the construction of the Grand Coulee Dam and much of their sacred land was lost due to flooding. Additionally, the dam was constructed without a fish ladder or any proper way for fish to pass through, disrupting the migration of salmon, sturgeon, and other species common to the region, which negatively impacted the ecosystem and disrupted the fishing practices of Native Americans in the area. Environmentalists and natives today still protest over the Grand Coulee Dam, and recent lawsuits have been filed by advocacy groups and native tribes against the U.S. Bureau of Reclamation in order to lessen the pollution of oil from the dam into the Columbia River and to help fish to properly migrate through the river. Additionally, Congress voted to compensate members of the Spokane Tribe in 2019 for the loss of their lands (Spokane Tribe of Indians of the Spokane Reservation Equitable Compensation Act of 2019).
A Case Study: La Grande Complex
The La Grande Complex in Québec was developed between 1973 and 1996 (Messier, 1998). The development is centered on the La Grande River, but the river’s natural flow has been augmented by diversions of the Caniapiscau River (48% of its flow) and the linked Eastmain and Opinaca Rivers (90% of their flow). The first phase of the development occurred between 1973 and 1985 and resulted in five reservoirs with a total impoundment area of 11,335 km2 (including 10,400 km2 of newly flooded land). Three powerhouses were built, with a total generating capacity of 10,282 MW. The second phase of the development, between 1987 and 1996, added five powerhouses (capacity 4,962 MW) and three new reservoirs (1,618 km2, including 1,134 km2 of flooded land). During the planning, construction, and operating phases of the development, Hydro-Québec undertook extensive studies of hydrology, climate, ecology, socio-economics, and other issues related to potential environmental impacts.
For several years after the new impoundments were flooded, there was a relatively high productivity of phytoplankton and zooplankton. This occurred because of the high concentrations of nutrients, especially phosphorus, that were leached from flooded soil. The resulting abundance of invertebrates and small fish allowed a relatively high productivity of lake whitefish (Coregonus clupeaformis) and northern pike (Esox lucius) for several years. However, mercury concentrations up to 3 ppm developed in these and other predatory fishes. The maximum concentrations in whitefish occurred five years after impoundment and subsequently declined, while those in pike peaked after 10 years. The mercury concentrations are expected to return to background levels after 10-25 years for fish that feed on invertebrates, and after 20-30 years for fish that feed on other fish.
Erosion associated with high-water discharges threatened the village of Fort George on the estuary of the La Grande River, forcing the relocation of its inhabitants to a new settlement upstream at Chisasibi. The relocation resulted in considerable social and lifestyle disruptions for the people, almost all of whom were Cree. The immense impoundments also affected the patterns of land-use by local hunters and trappers, some of whom no longer had access to their traditional areas. Greatly increased winter flows associated with hydroelectricity production have also created unstable ice conditions on the river. Consequently, some former winter travel routes are no longer safe to use.
Local people and their communities were also greatly affected by the diverse economic effects of the land-claim settlement and seven project-related agreements. (A total of $555 million was allocated for compensation and remedial work on Cree, Inuit, and Naskapi lands associated with the development of the La Grande Complex.) They were also greatly affected by the entry into wage employment, the construction of a network of roads and other infrastructure, the influx of many non-local people working on the hydro facilities, and by other rapid socio-economic changes. Some of the changes have been viewed favorably but others have not, particularly if they are considered to have degraded the traditional elements of Cree, Inuit, or Naskapi culture.
Impoundments for Flood Control and Irrigation
Some areas are highly vulnerable to flooding in the springtime, especially if the yield of water from the watershed due to rapid snowmelt or a severe rain event exceeds the capacity of a river channel, which may cause massive spillover onto normally terrestrial habitat. An area that is vulnerable to this kind of hydrological influence is known as a flood plain, and they are common in many parts of the U.S. Such flooding may occur regularly or it may happen only in years with unusually high water yield from the watershed. To prevent or reduce the damage caused by flooding, control structures such as dams, reservoirs, and channeled spillways may be constructed.
Some U.S. proposals to develop impoundments for flood control and irrigation have been extremely controversial. Two notable controversies are the Colorado River Storage Project and the damming of Hetch Hetchy.
The Colorado River Storage Project, or CRSP, began in the 1950’s in order to regulate the flow of the Colorado River, create hydroelectric power, store water for commercial use, and provide flood control. Due to water scarcity in the West, the Bureau of Reclamation and the Colorado River Commission worked together to study the Colorado River and pinpoint areas best suited for dam construction. Initially the Echo Park Dam was proposed for construction within Dinosaur National Monument in Colorado, which caused outrage amongst environmentalists. As a compromise, lawmakers halted plans to construct the Echo Park Dam from the CRSP and replaced it with plans to build the Glen Canyon Dam outside of any national park boundaries. In 1956 President Eisenhower signed the legislation, which included a provision that made it illegal to construct dams or reservoirs within national parks and monuments.
The Glen Canyon Dam was constructed in northern Arizona between 1956 and 1966 (Image 24.6). The construction of this dam created the Lake Powel reservoir, which has a capacity of 27 million acre-feet and is the second largest man-made reservoir in the U.S. The Glen Canyon Dam was constructed to generate hydroelectric power and bring irrigation water to dry farmlands in the west. While many land managers continue to support the project, Navajo people have criticized the dam for damaging their lands and filed a lawsuit against the Secretary of the Interior in 1974. Additionally, environmentalists have criticized the dam, as its construction caused the loss of important habitats within the canyon (United States Bureau of Reclamation, 2020).

Image 24.6. Glen Canyon Dam, June 2018. Source: “Glen Canyon Dam” by Bryan Egner, U.S. Department of Energy, is licensed under CC0 1.0.
Another controversial project occurred in California with the damming of Hetch Hetchy in Yosemite National Park. Congress debated whether or not to build a dam in the Hetch Hetchy Valley between 1908 and 1913. Supporters of damming the valley wanted to bring water to San Francisco, while conservationists worried about the damages that could occur constructing a dam within a national park. However, President Woodrow Wilson authorized the construction of the dam in 1913, despite public outrage. The controversy over this project led to greater public awareness surrounding the conservation of national parks and led to the creation of the National Park Service to protect national parks in 1916 (National Archives and Records Administration, 2021).
U.S. Focus 24.2. Disastrous Floods
Severe flooding is a natural catastrophe that can disrupt the lives of many people, even killing them, and causing extensive damage to homes, agriculture, and industry. Flood-control structures, such as dams, reservoirs, and levees, can help to prevent overflowing into vulnerable low-lying areas, but they are not fail-safe. Some examples of recent catastrophic flooding in Binghamton, NY occurred in 2006 and 2011.
From June 26th to June 28th in 2006, severe storms caused flash flooding in the Susquehanna River Basin throughout the Southern Tier region of New York and northern Pennsylvania. Record flooding occurred in Binghamton, NY, causing mass closures and evacuations. More than 3,000 residents were displaced, and thousands of homes and businesses were impacted or destroyed, causing nearly 200 million dollars in damages. The damages from the flooding led to new implementations for flood prevention and new inundation models designed to predict future flooding.
In 2011, from September 7th to 8th, Binghamton suffered another devastating flood, caused by Tropical Storm Lee, which brought heavy rains throughout the eastern U.S. (Image 24.7). Later called the Great Flood of 2011, this flood brought the Susquehanna River to even higher levels than in the flood of 2006, reaching a record of 35.25 ft in Vestal, NY. The flooding caused around 500 million dollars in damages in Broome County alone. Inundation models in place from the 2006 flood were instrumental in evacuating many from the devastating effects of this flooding- 24,000 people were safely evacuated throughout the Greater Binghamton Area (National Weather Service 2011).
Both the 2006 and 2011 floods are considered land-use floods, as human settlements were historically developed in the floodplain of the Susquehanna River. In response to these catastrophic events, the Federal Emergency Management Agency (FEMA) and state and local municipalities have invested more than $500 million into making Binghamton and surrounding Broome County a model for flood resiliency. Since 2011, the owners of more than 400 houses and other buildings at high risk of flooding have voluntarily accepted government buyouts, creating 146 acres of open space where floodwaters can spread out and soak into the ground. In addition, more than 170 flood-mitigation projects have been put in place. These include building an elementary school on stilts, enlarging culverts to channel more stormwater, creating wetlands at a highway interchange, and raising bridges and building concrete floodwalls around sewage treatment plants as well as other buildings.

Image 24.7. Flooding in Binghamton, New York. A view of the devastating flooding in 2011 in Binghamton, NY. Source: Bill Walsh via National Weather Service.
Conclusions
Eutrophication is a natural process in many waterbodies, in which it is characterized by increasing productivity resulting from an enhanced nutrient supply. In addition, “cultural eutrophication” is a widespread problem caused by anthropogenic influences, most commonly the dumping of inadequately treated sewage of humans or livestock, which deposits large amounts of nutrients into waterbodies. Eutrophication causes severe environmental damage, but it can be controlled by responsibly treating sewage and other nutrient-rich materials before wastewater is released into the environment. Severe environmental damage is also caused by dams and reservoirs, which may be developed for various purposes, such as to generate hydroelectricity, control flooding, or provide a reliable supply of water for irrigation or municipal needs. The environmental damage may include the flooding of natural habitat, increased mercury concentrations in fish, and the disruption of local people. To a large degree, these damages are an inevitable consequence of any decision to develop a dam and reservoir, and that is the reason why such proposals are always controversial.
Questions for Review
- Outline the evidence that phosphorus is the limiting nutrient for algal productivity in lakes.
- Lake Erie has been affected by a variety of environmental stressors. Which of them have caused the most damage to the lake?
- What are the major environmental impacts of hydroelectric developments? Briefly describe each of them.
- Why is methylmercury contamination of fish such a common occurrence after the development of a reservoir?
Questions for Discussion
- How is sewage treated in the community where you live? Describe the environmental benefits of treating your community’s sewage, and the damages of not doing so.
- Compare the major environmental effects of large impoundments and run-of-the-river hydroelectric developments.
- Are there any dams or reservoirs close to where you live? Identify one and prepare a list of the “benefits” and “damages” that it brings to society and the environment.
- Why do large hydroelectric proposals always engender such intense local controversy?
Exploring Issues
- A proposal is being made to develop a hydroelectric facility on a large river. There are two development options: (a) a run-of-the-river facility, and (b) a larger dam that would develop an extensive reservoir. Option (b) would generate considerably more electricity. You are an environmental scientist and have been asked to compare the potential environmental impacts of the two proposals. What major topics would you examine in your impact assessment? What do you think the likely results would be (in terms of the relative impacts of the two development options)?
References Cited and Further Reading
American Society of Civil Engineers. 2021. 2021 Report Card for America’s Infrastructure. https://infrastructurereportcard.org/wp-content/uploads/2020/12/National_IRC_2021-report.pdf. Accessed June 15, 2021.
Bellmore, J.R., J.J. Duda, L.S. Craig, S.L. Greene, C.E. Torgerson, M.J. Collins, and K. Vittum. 2017. Status and trends of dam removal research in the United States. WIREs Water 4:e1164. doi: 10.1002/wat2.1164.
Bian, Z., H. Tian, Q. Yang, R. Xu, S. Pan, and B. Zang. 2020. Gridded datasets of animal manure nitrogen and phosphorus production and application in the contentinal U.S. from 1860 to 2017. PANGEA https://doi.org/10.1594/PANGAEA.919937.
British Petroleum (BP). 2015. Statistical Review of World Energy 2014. BP, London, UK. https://web.archive.org/web/20140620032118/http://www.bp.com/en/global/corporate/about-bp/energy-economics/statistical-review-of-world-energy.html Viewed January, 2014.
Bureau of Reclamation. 2020. Columbia-Pacific Northwest Region. Columbia Basin Project, Bureau of Reclamation. https://www.usbr.gov/pn/grandcoulee/cbp/index.html. Accessed June 15, 2021.
California State Water Resources Control Board. 2017. Addressing Mercury in California’s Waters. California Environmental Protection Agency. Sacramento, CA.
Cooke, G.D. and E.B. Welch. 2005. Restoration and Management of Lakes and Reservoirs, 3rd ed. CRC Press, Boca Raton, FL.
Cowx, I.G. (ed.). 2002. Management and Ecology of Lake and Reservoir Fisheries. Blackwell Publishing, Oxford, UK.
Dodds, W.K. and M.R. Wiles. 2010. Freshwater Ecology: Concepts & Environmental Applications, 2nd ed. Academic Press, San Diego, CA.
Dorcey, T., A. Steiner, M. Acreman, and B. Orlando. 1997. Large Dams: Learning from the Past; Looking at the Future: Workshop Proceedings. IUCN, Gland, Switzerland.
Environmental Protection Agency (EPA). 2004. Report to Congress Impacts and Controls of CSOs and SSOs. https://www.epa.gov/sites/production/files/2015-10/documents/csossortc2004_full.pdf. Accessed June 15, 2021.
Environmental Protection Agency (EPA). 2007. State of the Great Lakes 2007. Washington, DC. https://archive.epa.gov/solec/web/pdf/7002_land_cover_conversion.pdf. Accessed June 15, 2021.
Environmental Protection Agency (EPA), 2020. Physical Features of the Great Lakes. Washington, DC. https://www.epa.gov/greatlakes/physical-features-great-lakes. Accessed June 15, 2021.
Flaccus, G. 2019, October 14. Pacific Northwest Tribes: Remove Columbia River Dams. Associated Press. https://apnews.com/article/dams-us-news-ap-top-news-the-dalles-wa-state-wire-dc9df60df54e46be9b17a3b792df12e1. Accessed June 15, 2021.
Freedman, B. 1995. Environmental Ecology. 2nd ed. Academic Press, San Diego, CA.
Goodland, R. 1993. Ethical Priorities in Environmentally Sustainable Energy Systems: Tropical Hydropower. Working Paper 67. World Bank Environment Department, Washington, DC.
Harper, D. 1992. Eutrophication of Freshwaters: Principles, Problems, and Restoration. Chapman & Hall, New York, NY.
International Commission on Large Dams. 2014. World Register of Dams. ICOLD, Paris, France.
International Monetary Fund (IMF). 2015. World Economic Outlook Database. Gross domestic product, current prices. IMF, Washington, DC. http://www.imf.org/external/pubs/ft/weo/2014/02/weodata/index.aspx.
International Rivers. N.d. Environmental Impact of Dams. https://archive.internationalrivers.org/environmental-impacts-of-dams. Accessed June 15, 2021.
Levine, S.N. and D.W. Schindler. 1989. Phosphorus, nitrogen, and carbon dynamics of Experimental Lake 303, during recovery from eutrophication. Canadian Journal of Fisheries and Aquatic Science, 46: 2-10.
Livingston, R.L. 2001. Eutrophication Processes in Coastal Systems: Origin and Succession of Plankton Blooms and Effects on Secondary Production. CRC Press, Boca Raton, FL.
Ludyanskiy, M.L., D. McDonald, and D. MacNeil. 1993. Impact of the zebra mussel, a bivalve indicator. BioScience, 43: 533-544.
Makarewicz, J.C. and P. Bertram. 1991. Evidence for the restoration of the Lake Erie ecosystem. BioScience, 41: 216-223.
Messier, D. 1998. The La Grande Rivière Hydroelectric Complex in Northern Quebec. Hydro-Québec, Montreal, QC.
Mills, E.L., J.H. Leach, J.T. Carlton, and C.L. Secar. 1993. Exotic species in the Great Lakes: A history of biotic crises and anthropogenic introductions. Journal of Great Lakes Research, 19: 1-54.
National Archives and Records Administration, 2021. Hetch Hetchy Environmental Debates. National Archives and Records Administration. Washington, DC. www.archives.gov/legislative/features/hetch-hetchy. Accessed June 15, 2021.
Pitzer, P. C. 1994. Grand Coulee: Harnessing a Dream. Washington State University Press. Pullman, WA.
National Weather Service. 2011. Flood of September 07-08, 2011. https://www.weather.gov/bgm/pastFloodSeptember072011. Accessed June 15, 2021.
Washington State Recreation and Conservation Office. 2020. State of Salmon in Watersheds. https://stateofsalmon.wa.gov. Accessed June 15, 2021.
Candela Citations
- Environmental Science . Authored by: Bill Freedman . Provided by: Dalhousie University. Located at: https://digitaleditions.library.dal.ca/environmentalscience/. License: CC BY-NC: Attribution-NonCommercial

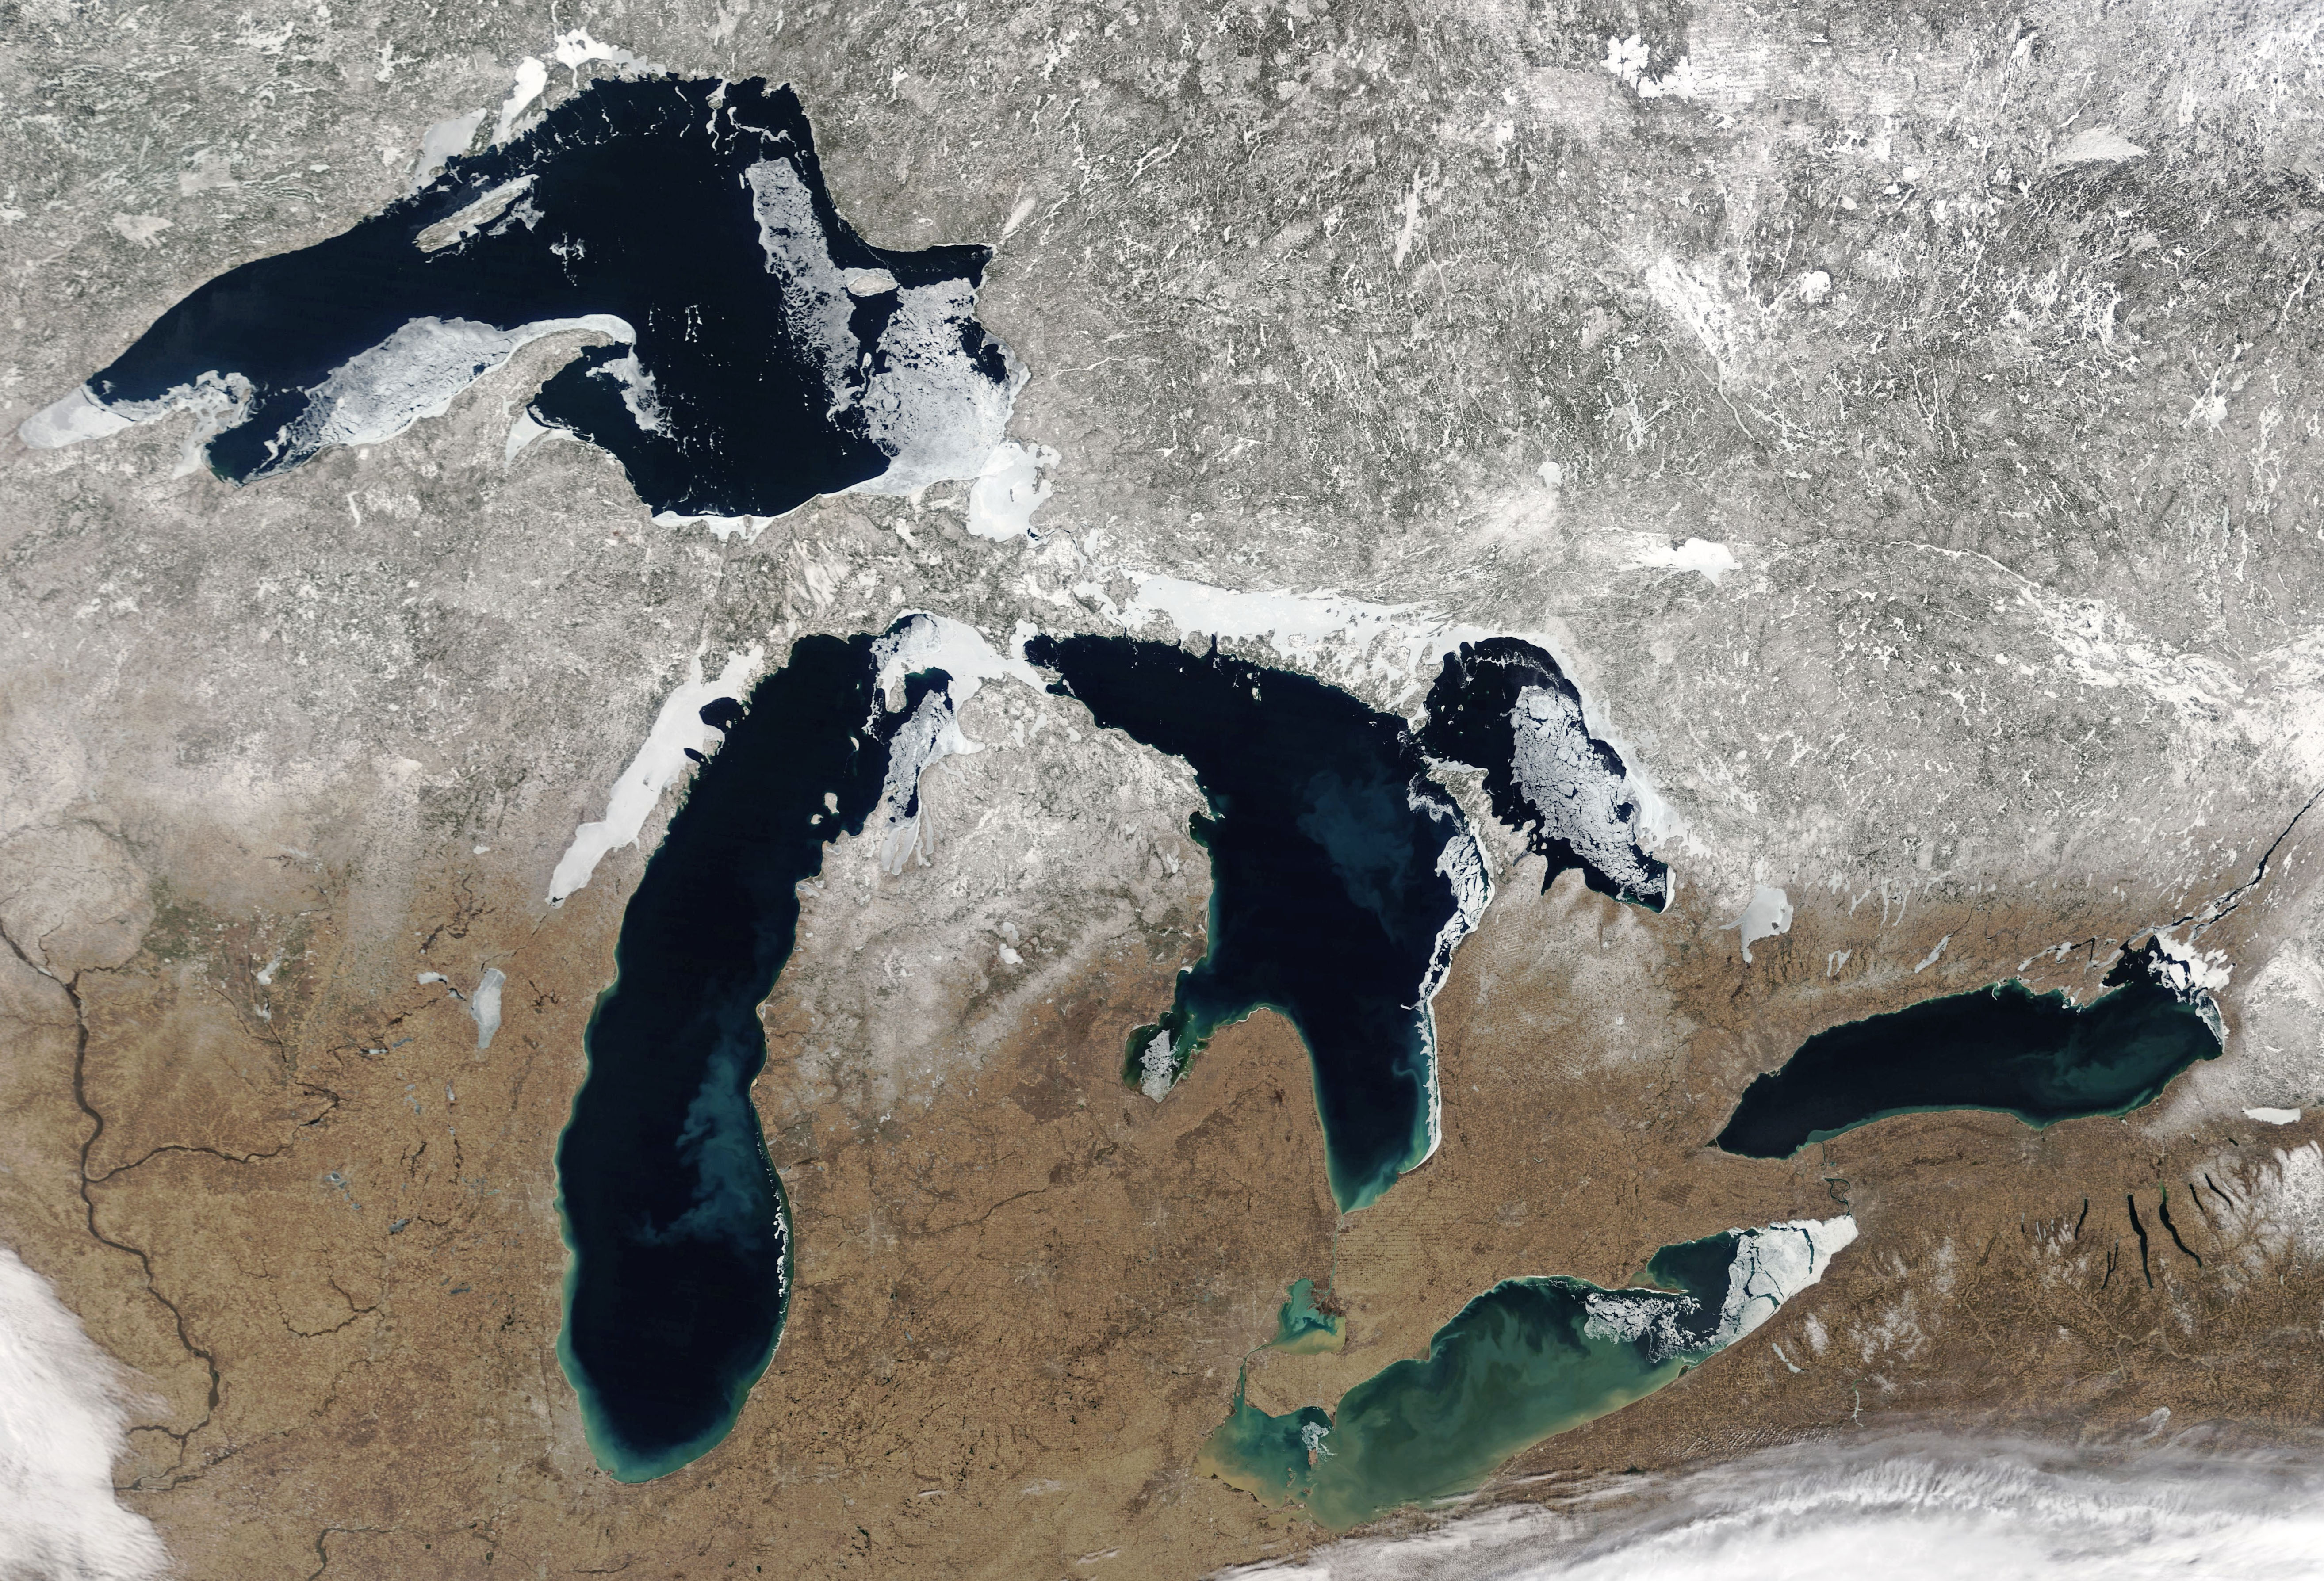