Rich data exists on most health conditions—from chronic to acute illnesses to injuries and disabilities. These data come from a variety of sources including the census, electronic medical records, national surveys, surveillance systems, and vital statistics.
Some data are collected by state agencies and some by federal agencies. It can be very difficult to compare data collected by different groups because the data may not be collected or analyzed the same way. There may be privacy issues that prevent agencies from sharing data, especially health data.
Hazard Data Types
The main types of hazard data that systems contain include:
Site specific:
When samples, observations, inspection reports or source/compliance tests are conducted at a specific location.
Facility data:
Any facility that emits pollutants into the environment is required by law to keep detailed records of these emissions and to report them to the U.S. Environmental Protection Agency (EPA). Extensive hazard data are generated from internal records of these facilities and from their publicly available reports.
Environmental monitoring:
Is periodic or continuous surveillance or testing. Data are gathered from fixed points within the environment (e.g., air monitoring stations, routine groundwater sampling, or monitoring of wells) to determine pollutant levels.
Modeling is a mathematical method:
Using known information to make simulations, estimates, or predictions about a system or condition. For example, modeled air data are used to estimate levels of ozone and particulate matter in the air. These data are applied to areas that do not have air quality monitors and to fill in time gaps when monitors may not be recording data.
So, where does this modeled air data come from? The EPA maintains a database called the Air Quality System. This system contains data from about 4,000 monitoring stations around the country. However, these monitoring stations don’t operate all the time and are in only about 20 percent of the counties in the United States.
Modeled air data statistically combine monitoring data from the Air Quality System with results from another EPA dataset called the Community Multiscale Air Quality model. Though it would be more desirable to have environmental monitoring data for more counties or have personal monitoring for measurement of the immediate and continually changing environment of individuals or populations, this is typically cost-prohibitive.
Hazard data, which various agencies collect, encompass data from environmental monitoring of sources such as air, water, soil, food, and vectors, as well as data derived from estimates, models, source measurements, calculations, and facility and other reports. A typical example of hazard surveillance is air pollution monitoring in a certain area. Many hazard data systems have been established and are already in use across the United States. This systems store information on a variety of possible hazards, from chemical spills to air pollution.
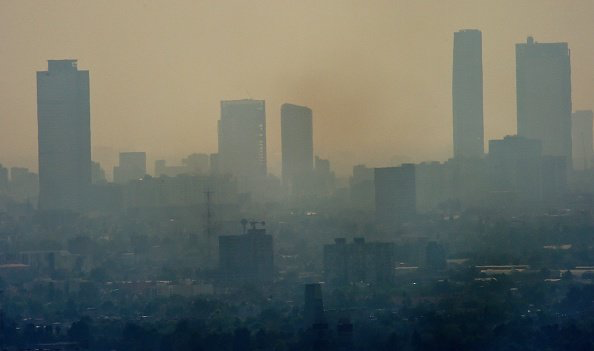
View of Mexico City amid smog on Dec. 26, 2015. Mexico City is considered one of the most polluted cities in the world. Ronaldo Schemidt-AFP/Getty Images
- Air: The United States Environmental Protection Agency (EPA) has a repository of air quality data called the Air Quality System (AQS). This database contains measurements of criteria air pollutant concentrations in the United States.
- Water: An illustration of a water hazards database is the federal Safe Drinking Water Information System (SDWIS), an EPA database containing national information about public supplies of drinking water.
- Soil or Sediment contamination: The EPA also has databases that include information regarding the distribution and concentration levels of contaminants in soil and sediment. An example is the CERCLIS database. This is the Comprehensive Environmental Response, Compensation and Liability Information System (CERCLIS), and it contains information on hazardous waste sites (Superfund sites), potentially hazardous waste sites, and remedial activities across the nation. The database includes sites on the National Priorities List (NPL) or that are under consideration for the NPL.
- Community Design: Community design refers to all the elements of a community that are human-made and form the physical characteristics of that community. This includes: buildings, such as schools, workplaces, and homes, roads, parks and recreation areas, transportation systems, and places to buy food. One data source example used for environmental public health includes results from the US Census Bureau’s American Community Survey (ACS) (http://www.census.gov/acs/www/). The survey is conducted by the US Census Bureau in every county, American Indian and Alaska Native area, and Hawaiian Home Land. ACS collects data on demographic characteristics, family and relationships, income, health insurance, education, veteran status, where people work and how they get there, and homeowner status.
- Weather and Climate: Weather and climate have affected human health for millennia. Now, climate change is altering weather and climate patterns that previously had been relatively stable. Climate experts are particularly confident that climate change will bring increasingly frequent and severe heat waves and extreme weather events, as well as a rise in sea levels. These changes have the potential to affect human health in several direct and indirect ways, some of them severe. The National Oceanic and Atmospheric Administration (NOAA) collects temperature, precipitation, tropical cyclone intensity, and ocean conditions (e.g., sea level, temperature, acidity) data.
Candela Citations
- Authored by: Jessica S. Kruger, PhD, CHES. Located at: https://courses.lumenlearning.com/suny-buffalo-environmentalhealth/. Project: Models and Mechanisms of Public Health. License: CC BY-NC-SA: Attribution-NonCommercial-ShareAlike