Learning Outcomes
- Prepare journal entries for a process costing system
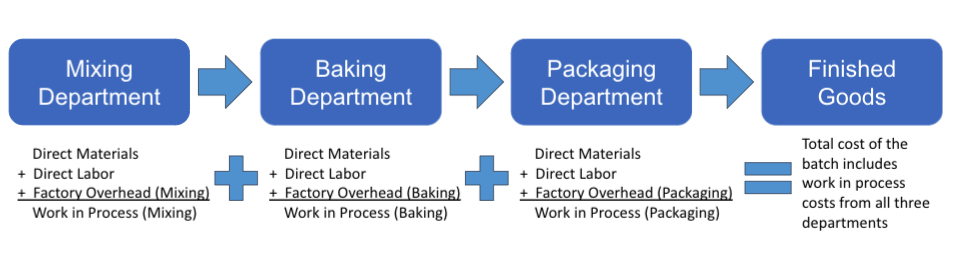
Costs are recorded in the accounting records in various ways according to company policies, but in essence, each cost related to a product is accumulated in work-in-process until the goods are finished. When the product is sold, the cost of the product is moved from Finished Goods Inventory to Cost of Goods Sold.

See the illustration long description here.
Let’s trace some representative transactions through Dad’s Perfect Pies accounting system.
First, for the sake of simplicity, let’s assume that as of the start of business on January 1, there were only two general ledger accounts with balances: the checking account and the owner’s capital account. All journal entries and ledger accounts are expressed in dollars, but the dollar signs in this example have been omitted, which is customary in accounting records.

On January 2nd, the company paid rent on the facility and machines. For purposes of this example, we’ll limit the transactions to factory overhead. Normally, all kinds of expenses would be posted to this account, and there would also be general, selling, and administrative expenses that would be posted to other expense accounts not related to the manufacturing process.
| Date | Account/Explanation | Debit | Credit |
|---|---|---|---|
| Jan 02 | Factory Overhead | 3,500 | |
| Checking Account | 3,500 | ||
| Rent on manufacturing facility |
This would then be posted on the appropriate ledger pages:

That same day the company bought 2 tons of flour @ $0.60/lb, 1 ton of butter at $1.20/lb, and 3200 pie tins @.25 each. The supplier extended the company credit terms of 30 days.
| Date | Account/Explanation | Debit | Credit |
|---|---|---|---|
| Jan 02 | Raw Materials – direct | 5,600 | |
| Accounts Payable | 5,600 | ||
| Purchased materials on account |

Then the company bought sugar, salt, and other indirect raw materials:
| Date | Account/Explanation | Debit | Credit |
|---|---|---|---|
| Jan 02 | Raw Materials – indirect | 600 | |
| Accounts Payable | 600 | ||
| Purchased materials on account. |

And on January 3rd, the Mixing Department production manager submitted a raw materials requisition order to the inventory manager for 500 pounds of flour and 375 pounds of butter–enough raw materials to mix up a batch of 750 pie crusts. This results in a journal entry that moves the cost of the materials from raw materials to work in process. Five hundred pounds of flour that cost $0.60 per pound = $300, and 375 pounds of butter at $1.20 per pound = $450, which is $750 total, which comes to $1 in raw materials per pie shell (each shell takes ⅔ pound of flour and half a pound of butter). These would then be the equivalent of standard costs and standard quantities.
| Date | Account/Explanation | Debit | Credit |
|---|---|---|---|
| Jan 03 | Work in Process | 750 | |
| Raw materials – direct | 750 | ||
| Started batch 1 – moved raw materials into production |

By crediting the asset account Raw Materials – direct and debiting the asset account Work in Process – Mixing, the cost of the raw materials are “reassigned” from the inventory pool to the process.

You can review the rules of debit and credit by watching this video:
You can view the transcript for “Debits and Credits MADE EASY with ADEx LER” here (opens in new window).
The company started another batch on January 15th:
| Date | Account/Explanation | Debit | Credit |
|---|---|---|---|
| Jan 15 | Work in Process | 750 | |
| Raw materials – direct | 750 | ||
| Started batch 2 – moved raw materials into production |
A 3rd batch on the 21st:
| Date | Account/Explanation | Debit | Credit |
|---|---|---|---|
| Jan 21 | Work in Process | 750 | |
| Raw materials – direct | 750 | ||
| Started batch 3 – moved raw materials into production |
And a 4th batch on the 28th:
| Date | Account/Explanation | Debit | Credit |
|---|---|---|---|
| Jan 28 | Work in Process | 750 | |
| Raw materials – direct | 750 | ||
| Started batch 4 – moved raw materials into production |
Resulting in the following ledger balances:
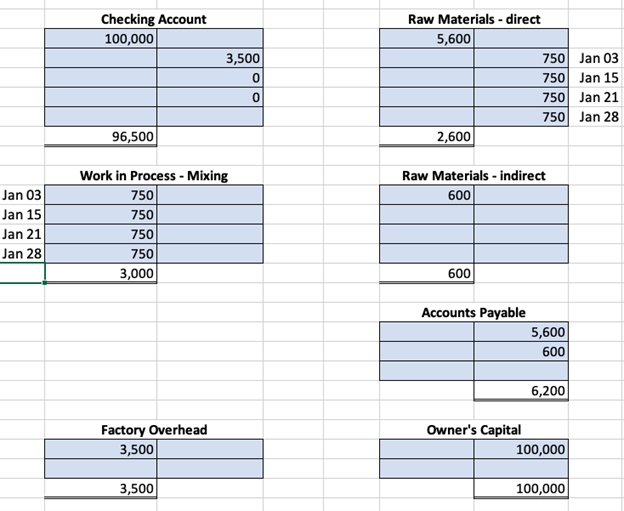
See the image long description here.
At the end of the month, a physical count of the indirect raw materials (sugar, salt, etc.) revealed that there was $200 (at original cost) of supplies left in those bins, so the accountants made the following entry to factory overhead:
| Date | Account/Explanation | Debit | Credit |
|---|---|---|---|
| Jan 31 | Factory Overhead | 400 | |
| Raw materials – indirect | 400 | ||
| adjust raw materials inventory |
Which, when posted, moved the cost of indirect raw materials to factory overhead:

Meanwhile, the baking/packaging department used 2,400 pie tins that cost $0.25 each. They add them at the end of the process as they are packaging because the pie shells are cooked upside-down on a baking mold. The tins are part of final preparation for freezing and shipping. Although the tins were used as each batch was completed, we’ll just make one journal entry at the end of the period.
| Date | Account/Explanation | Debit | Credit |
|---|---|---|---|
| Jan 31 | Work-in-process – Baking/Packaging | 600 | |
| Raw materials – direct | 600 | ||
| Record raw materials used in packaging |

Also on the 31st, the payroll department calculated the wages owed to workers. Based on the time cards, wages were split as follows:
| Date | Account/Explanation | Debit | Credit |
|---|---|---|---|
| Jan 31 | Work-in-process – Mixing | 1,440 | |
| Work-in-process – Baking/Packaging | 1,100 | ||
| Factory Overhead | 900 | ||
| Wages Payable | 3,440 | ||
| To accrue factory wages |

The company allocated Manufacturing Overhead to the Mixing Department based on Direct Machine Hours at a rate of $0.50 per hour. Machine hours for January were 3,600, resulting in an allocation of $1,800 of factory overhead to the mixing department.
| Date | Account/Explanation | Debit | Credit |
|---|---|---|---|
| Jan 31 | Work-in-process – Mixing | 1,800 | |
| Factory Overhead | 1,800 | ||
| Allocate factory overhead |

We can now create the production cost report for the mixing department to determine the cost of product transferred out to baking/packaging:
| Equivalent Units | ||||
| Subcategory, UNITS | Physical Units | Single LineDirect Materials | Single LineConversion Costs | |
| Subcategory, Units to account for: | Single Line | Single Line | Single Line | |
| Beginning work-in-process | 0 | |||
| Started in production | 3,000 | |||
| Total units to account for | Single Line3,000Double line | |||
| Subcategory, Units accounted for: | ||||
| Completed and transferred out | 2,250 | 2,250 | 2,250 | |
| Ending work-in-process | 750 | 750 | 450 | |
| Total units accounted for | Single Line3,000Double line | Single Line3,000Double line | Single Line2,700Double line | |
| Subcategory, COSTS | Direct Materials | Conversion Costs | Total Costs | |
| Subcategory, Costs to account for: | ||||
| Beginning work-in-process | $ – | $ – | $ – | |
| Costs added during the period | $ 3,000 | $ 3,240 | $ 6,240 | |
| Total costs to account for | Single Line$ 3,000 | Single Line$ 3,240 | Single Line$ 6,240Double line | |
| Divided by: Total EUP | 3,000 | 2,700 | ||
| Cost per equivalent unit | Single Line$ 1.00Double line | Single Line$ 1.20Double line | ||
| Subcategory, Costs accounted for: | ||||
| Completed and transferred out | $ 2,250 | $ 2,700 | $ 4,950 | |
| Ending work-in-process | $ 750 | $ 540 | $ 1,290 | |
| Total costs accounted for | Single Line$ 3,000Double line | Single Line$ 3,240Double line | Single Line$ 3,240Double line | |
And then journalize and post the transfer:
| Date | Account/Explanation | Debit | Credit |
|---|---|---|---|
| Jan 31 | Work-in-process – Baking/Packaging | 4,950 | |
| Work-in-process – Mixing Dept | 4,950 | ||
| Record transfer of pie shells |

Next, we allocate factory overhead to the baking/packaging department. In this example, we’ll use a rate of $30/machine-hour against 100 machine hours for a total allocation of $3,000. Using standard costs like this usually leaves some under or over-allocated factory overhead that we would eventually have to account for, but in this example, we will be allocating all of the factory overhead with no left-over.
| Date | Account/Explanation | Debit | Credit |
|---|---|---|---|
| Jan 31 | Work-in-process – Baking/Packaging | 3,000 | |
| Factory Overhead | 3,000 | ||
| Allocate factory overhead to baking |

And now we can complete the production cost report for the baking/packaging department:
| Equivalent Units | |||||
| Subcategory, UNITS | Physical Units | Single LineTransferred In | Single LineDirect Materials | Single LineConversion Costs | |
| Subcategory, Units to account for: | Single Line | Single Line | Single Line | Single Line | |
| Beginning work-in-process | 0 | ||||
| Transferred in from mixing | 2,250 | ||||
| Total units to account for | Single Line2,250Double line | ||||
| Subcategory, Units accounted for: | |||||
| Completed and transferred out | 2,000 | 2,000 | 2,000 | 2,000 | |
| Ending work-in-process | 250 | 250 | 0 | 50 | |
| Total units accounted for | Single Line2,250Double line | Single Line2,250Double line | Single Line2,000Double line | Single Line2,050Double line | |
| Subcategory, COSTS | Transferred In | Direct Materials | Conversion Costs | Total Costs | |
| Subcategory, Costs to account for: | Single Line | Single Line | Single Line | Single Line | |
| Beginning work-in-process | $ – | $ – | $ – | $ – | |
| Costs added during the period | $ 4,950 | $ 600 | $ 4,100 | $ 9,650 | |
| Total costs to account for | Single Line$ 4,950 | Single Line$ 600 | Single Line$ 4,100 | Single Line$ 9,650 | |
| Divided by: Total EUP | 2,250 | 2,000 | 2,050 | ||
| Cost per equivalent unit | Single Line$ 2.20Double line | Single Line$ 0.30Double line | Single Line$ 2.00Double line | ||
| Subcategory, Costs accounted for: | |||||
| Completed and transferred out | $ 4,400 | $ 600 | $ 4,000 | $ 9,000 | |
| Ending work-in-process | $ 550 | $ – | $ 100 | $ 650 | |
| Total costs accounted for | Single Line$ 4,950Double line | Single Line$ 600Double line | Single Line$ 4,100Double line | Single Line$ 9,650Double line | |
Notice that the total costs to be accounted for are taken from the general ledger account, and that we are transferring out 2,000 completed units at a total cost of $9,000, which is $4.50 per unit.
| Date | Account/Explanation | Debit | Credit |
|---|---|---|---|
| Jan 31 | Finished Goods Inventory | 9,000 | |
| Work-in-process – Baking/Packaging | 9,000 | ||
| Record cost of completed units transferred to storage |

To finish off the cycle, let’s say we sold 1,600 pie shells at $6 per shell, to a wholesaler/distributor on the last day of the month.
| Date | Account/Explanation | Debit | Credit |
|---|---|---|---|
| Jan 31 | Accounts Receivable | 9,600 | |
| Sales Revenue | 9,600 | ||
| Cost of Goods Sold | 7,200 | ||
| Finished Goods Inventory | 7,200 | ||
| Record sale of 1600 pie crusts to wholesaler @ $6 |
Obviously, there would be many more transactions in a real business, even a small one like this, and there would be selling, general, and administrative costs as well. But we’ll end this example here, with the posting of the sale that records the revenue earned but not yet collected, and the cost of the 1,600 shells sold being transferred from Finished Goods to Cost of Goods Sold.


Here are the final account tallies from the general ledger showing that debits equal credits:
| Dad’s Perfect Pies | |||
| Trial Balance | |||
| Jan 31 | |||
| DR | CR | ||
| Checking Account | 96,500 | ||
| Accounts Receivable | 9,600 | ||
| Raw Materials – direct | 2,000 | ||
| Raw Materials – indirect | 200 | ||
| Work in Process – Mixing | 1,290 | see production cost report | |
| Work in Process – Baking/Packaging | 650 | see production cost report | |
| Finished Goods | 1,800 | 400 finished pie shells at $4.50 ea | |
| Accounts Payable | 6,200 | ||
| Wages Payable | 3,440 | ||
| Owner’s Capital | 100,000 | ||
| Sales Revenue | 9,600 | 1600 shells @$6.00 each | |
| Cost of Goods Sold | 7,200 | 1600 shells @ $4.50 each | |
| Factory Overhead | – | ||
| Single Line119,240Double line | Single Line119,240Double line |
And a reconciliation of the direct raw materials purchased, used, and remaining:
| Direct Materials Inventory Count – Jan 31 | |||
| Flour | Butter | Tins | |
| Purchased, in pounds | 4,000 | 2,000 | 3,200 |
| used for batch 1 | (500) | (375) | (800) |
| used for batch 2 | (500) | (375) | (800) |
| used for batch 3 | (500) | (375) | (800) |
| used for batch 4 | (500) | (375) | 0 |
| Left | Single Line2,000 | Single Line500 | Single Line800 |
| Cost | $0.60 | $1.20 | $0.25 |
| Remaining ($2,000 total) | Single Line$1,200.00Double line | Single Line$600.00Double line | Single Line$200.00Double line |
Notice that the $1,290 of ending work-in-process for the mixing department ties to the production cost report, as does the ending work in process of $650 for the baking/packaging department.
By reconciling and proving each account, financial and managerial accountants verify that the information fairly represents the actual costs and results of operations.
You can view the transcript for “Process Costing Journal Entries” here (opens in new window).
Before we take a final look at the production cost report from an analysis standpoint, check your understanding of the recording process that gives us the accurate information we need to track costs.
Practice Question
Candela Citations
- Journal Entries. Authored by: Joseph Cooke. Provided by: Lumen Learning. License: CC BY: Attribution
- Cost Flows in a Process Cost System, from Accounting Principles: A Business Perspective. Authored by: James Don Edwards, University of Georgia & Roger H. Hermanson, Georgie State University. Provided by: Endeavour International Corporation. Project: The Global Text Project. License: CC BY: Attribution
- Debits and Credits MADE EASY with ADEx LER. Authored by: Leila Gharani. Located at: https://youtu.be/ICDJrsg4abg. License: All Rights Reserved. License Terms: Standard YouTube License
- Process Costing Journal Entries. Authored by: Edspira. Located at: https://youtu.be/aN-9PhQvmjE. License: All Rights Reserved. License Terms: Standard YouTube License
