Learning Outcomes
- Create cost statements for a manufacturing company
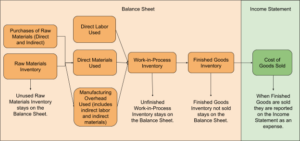
When manufactured items are sold, their costs are removed from the Finished Goods inventory account and transferred to the Cost of Goods Sold expense account on the income statement. Cost of Goods Sold represents the amount a company paid for the manufactured items that it sold. Cost of Goods Sold is matched with Sales on the first two rows of the income statement. The difference between Sales and Cost of Goods Sold is gross profit, which is the amount of markup on the manufactured goods.
If our product costs us $395 to manufacture, and we sell them for $555, we are making a gross profit of $160 per unit. That is our markup, and it goes to cover period costs, such as selling, general, and administrative expenses, including taxes. Anything left over is profit.
The Cost of Goods Sold amount on the income statement is determined by considering the changes in the three inventory account balances during the period. The elements of its calculation contain important information for managers, but they are too detailed and lengthy to present directly on the income statement. Therefore, a separate statement of cost of goods sold is prepared to show the details of the calculations. The final cost of goods sold amount from the statement of cost of goods sold is what appears on the income statement.
Let’s review the schedule of cost of goods manufactured:
| Description | Amount | Total |
|---|---|---|
| Beginning Work-in-Process Inventory | $ 66,000 | |
| Direct Materials Used: | ||
| Beginning Direct Materials | $ 12,000 | |
| Purchases of Direct Materials (including Freight In) | 160,000 | |
| Direct Materials Available for Use | Single Line172,000 | |
| Ending Direct Materials | (5,000) | |
| Direct Materials Used | Single Line167,000 | |
| Direct Labor | 88,000 | |
| Manufacturing Overhead | 90,000 | |
| Total Manufacturing Costs Incurred during the Year | Single Line | 345,000 |
| Total Manufacturing Costs to Account For | Single Line411,000 | |
| Ending Work-in-Process Inventory | (16,000) | |
| Cost of Goods Manufactured | Single Line$395,000Double line |
Our beginning dollar amount for finished goods inventory is based on last month’s ending inventory. Let’s say that last month, our unit cost was $400 and we had 60 units on hand. The total cost of inventory on June 30 at midnight was $24,000 (400 * 60).
Therefore, the total cost of finished goods inventory at the start of business on July 1 was $24,000.
If our unit cost was $395 for the month of July, and at the close of business on July 31 we count 90 units on hand, then our July 31 ending inventory at cost is $35,550 (395 * 90).
Using the formula:
We calculate cost of goods sold as follows:
| Description | Blank Column | Blank Column | Total |
|---|---|---|---|
| Beginning Finished Goods Inventory | $ 24,000 | ||
| Cost of Goods Manufactured | 395,000 | ||
| Cost of Goods Available for Sale | Single Line419,000 | ||
| Ending Finished Goods Inventory | (35,550) | ||
| Cost of Goods Sold | Single Line$ 383,450Double line |
To make the manufacturer’s income statement more understandable to readers of the financial statements, financial accountants do not show all of the details that appear in the Cost of Goods Manufactured statement.
We are assuming in this case that we sold all 60 of the units we had on hand at the beginning of the month (called the FIFO assumption — First-in, First-out).
Let’s reconcile our calculation just to make sure we got it right.
If we started with 60 units, and completed 1,000, and then had 90 left, we must have sold 970.
| Description | Blank Column | Total |
|---|---|---|
| Beginning Finished Goods Inventory | 60 | |
| Goods Manufactured | 1,000 | |
| Goods Available for Sale | Single Line1,060 | |
| Ending Finished Goods Inventory | (90) | |
| Goods Sold | Single Line970Double line |
Of those 970 units we sold, 60 were on hand at the beginning of the month at a cost of $400 each, and the other 910 were from July production at $395 per unit.
| Description | Blank Column | Units of Inventory | Price Per Unit | Total |
|---|---|---|---|---|
| Beginning inventory sold | 60 | $ 400 | $ 24,000 | |
| July inventory sold | 910 | $ 395 | 359,450 | |
| Single Line970Double line | Single Line$ 383,450Double line |
Let’s take a look at how this might look on the financial statements for our company.
| Description | Amount |
|---|---|
| Sales | $ 538,350 |
| Cost of goods sold | 383,450 |
| Gross profit | Single Line154,900 |
| Selling, general, and administrative expenses | 95,000 |
| Net income before taxes | Single Line59,900 |
| Income tax expense | 20,366 |
| Net income | Single Line$ 39,534Double line |
For now, it’s enough to understand that managerial accountants track production costs and transfer those costs from account to account based on each stage of completion. This information is critical to managers in manufacturing companies who make purchasing decisions, determine selling prices, prepare sales budgets, and schedule production. We’ll address the question of exactly HOW costs are assigned to each product during the manufacturing process in later modules on process and job costing, but first, check your understanding of the flow of costs.
Practice Question
Candela Citations
- Cost of Goods Sold. Authored by: Joseph Cooke. Provided by: Lumen Learning. License: CC BY: Attribution
- Principles of Managerial Accounting. Authored by: Christine Jonick. Located at: https://ung.edu/university-press/books/managerial-accounting.php. License: CC BY-SA: Attribution-ShareAlike
- Balance Sheet / Income Statement. Authored by: Lumen Learning. Provided by: Lumen Learning. License: CC BY: Attribution
