Learning Outcomes
- Understand supply and demand
 One of the most overlooked aspects of pricing from a managerial accounting standpoint is the effect of market forces, also known as supply and demand.
Supply is the amount of the good that is being sold onto the market by producers. At higher prices, it is more profitable for firms to increase supply.
Demand is the quantity of the good that consumers wish to buy at different prices. At higher prices, less will be demanded. As prices fall, more will be demanded.
These two concepts work in concert. For example, let’s say as the worldwide demand for phones increases, the price is driven up, prompting phone-makers to make more and more phones. The phone producers have now made so many phones there is a surplus. With supply now outstripping demand, phones are easy to get and producers want to unload inventory, so prices (P) fall, increasing the quantity (Q) of phones demanded as more and more people can afford them.
Economists illustrate this using supply and demand curves. Let’s ignore the supply curve for now since that is more of an overall market issue. Let’s assume that REVLAND can sell as many helmets as they can produce because there isn’t a lot of competition in the market for their particular product that includes crash sensors. At some point, as competition increases, an overabundance of supply will drive prices down. But for now, let’s just look at a hypothetical demand curve for REVLAND based on current data provided by the marketing firm:
| Price (P) | Demand (Q) |
| $ 750.00 | 0 |
| $ 700.00 | 50 |
| $ 650.00 | 100 |
| $ 600.00 | 200 |
| $ 550.00 | 300 |
| $ 500.00 | 400 |
| $ 450.00 | 550 |
| $ 400.00 | 700 |
| $ 350.00 | 950 |
| $ 300.00 | 1200 |
Here is that same data presented as a line graph showing the demand curve:
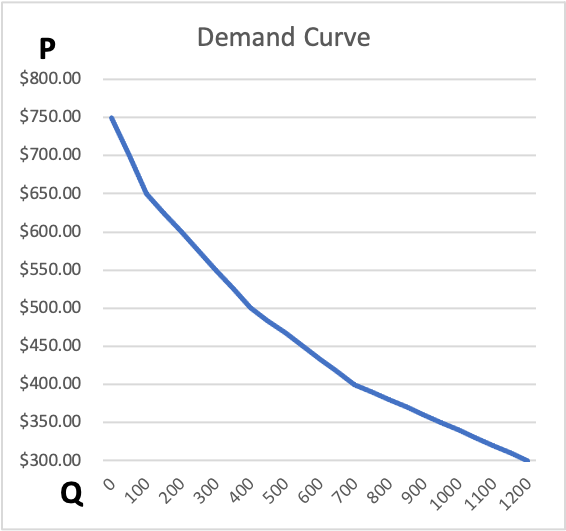
Nobody wants to buy this helmet at $750 because there are other options out there. Lots of people want to buy it at $300, but can the company afford to sell it at that price?
Let’s look again at REVLAND’s break-even analysis that was prepared based on a selling price of $400. According to the demand curve, that is the price point that would result in roughly 700 units. But businesses want to make a profit, not just break-even.
| Units | $/unit | Total | |
|---|---|---|---|
| Sales | 702 | $400.00 | $ 280,800.00 |
| Variable costs | 702 | $286.00 | 200,772.00 |
| Contribution Margin | $114.00 | Single Line80,028.00 | |
| Fixed costs | 80,000.00 | ||
| Operating income | Single Line$ 28.00Double line | ||
| CM ratio | 28.50% |
We’ll look at the effect of pricing on different levels of sales as we examine target pricing in the next section. For now, just notice that increasing and decreasing the amount of units sold for most businesses is directly tied to the sales price.
Before we move on, note that supply and demand issues will be different for different kinds of markets. Most businesses in the United States operate in a monopolistic competition market, where there are large numbers of buyers and sellers and similar but differentiated goods. Compare Indian motorcycles to Harley-Davidson, Honda, BMW, and others. Or compare Ford, Chevrolet, Nissan, and the other automakers. Your local coffee shop operates in a market of monopolistic competition. However, compare a backpack at your local Walmart to a Louis Vuitton backpack. Both are functionally the same, but because Louis Vuitton has differentiated its product by brand name, a small backpack by that company sells for upward of $2,000. A sturdy, functional, stylish Walmart backpack goes for about $40.
In other words, pricing a product is part science, part art form.
Here is a short video explaining the broader concepts of supply and demand that you will study, or have already studied, in your economics classes:
You can view the transcript for “What Is Supply and Demand?” here (opens in new window).
Now, check your understanding of supply and demand.
Practice Question
Candela Citations
- Market Forces. Authored by: Joseph Cooke. Provided by: Lumen Learning. License: CC BY: Attribution
- Motorcycle helmet. Provided by: Unsplash. Located at: https://unsplash.com/photos/4IvEJuFlYqg. License: CC0: No Rights Reserved
- What Is Supply and Demand?. Authored by: IMF. Located at: https://youtu.be/2Wp-diDRVKI. License: All Rights Reserved
