Learning Outcomes
- Prepare a production cost report for a second or subsequent stage of a multi-step process using the weighted-average method
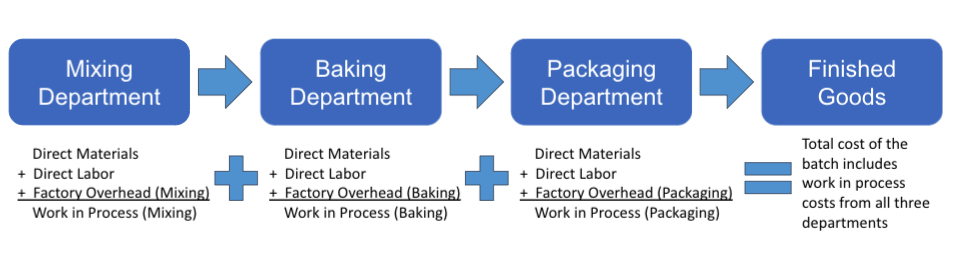
Once the mixing department is done converting direct materials (flour and butter) and indirect materials (salt and sugar) into raw shells using direct labor, indirect labor, and other factory overhead, the materials are transferred out into the next stage – in this case, baking, and for purposes of this illustration, we’re going to combine the baking and packaging departments into one cost center.
Before we examine subsequent departments, let’s review the Production Cost Report from the first stage of production– the mixing department for the month of January:
| Equivalent Units | ||||
|---|---|---|---|---|
| UNITS | Physical Units | Single LineDirect Materials | Single LineConversion Costs | |
| Subcategory, Units to account for: | Single Line | Single Line | Single Line | |
| Beginning work-in-process | 0 | |||
| Started in production | 3,000 | |||
| Total units to account for | Single Line3,000Double line | |||
| Subcategory, Units accounted for: | ||||
| Completed and transferred out | 2,250 | 2,250 | 2,250 | |
| Ending work-in-process | 750 | 750 | 450 | |
| Total units accounted for | Single Line3,000Double line | Single Line3,000Double line | Single Line2,700Double line | |
| COSTS | Direct Materials | Conversion Costs | Total Costs | |
| Subcategory, Costs to account for: | ||||
| Beginning work-in-process | $ – | $ – | $ – | |
| Costs added during the period | $ 3,000 | $ 3,240 | $ 6,240 | |
| Total costs to account for | Single Line$ 3,000 | Single Line$ 3,240 | Single Line$ 6,240Double line | |
| Divided by: Total EUP | 3,000 | 2,700 | ||
| Cost per equivalent unit | Single Line$ 1.00Double line | Single Line$ 1.20Double line | ||
| Subcategory, Costs accounted for: | ||||
| Completed and transferred out | $ 2,250 | $ 2,700 | $ 4,950 | |
| Ending work-in-process | $ 750 | $ 540 | $ 1,290 | |
| Total costs accounted for | Single Line$ 3,000Double line | Single Line$ 3,240Double line | Single Line$ 6,240Double line | |
Take note of the following:
- Units transferred out = 2,250. They were transferred out to the baking/packaging department because they were 100% complete.
- They carried with them $4,950 in accumulated costs.
Preparing the Production Cost Report for subsequent departments is similar to preparing the report for the first department, with the addition of a column for costs transferred in.
Let’s make these assumptions for the baking/packaging department for the month of January:
- Jan 14: 750 pie crusts (uncooked) transferred from mixing to baking/packaging – baked, packaged, quality-checked, and transferred to the cooler on Jan 19.
- Jan 20: 750 pie crusts (uncooked) transferred from mixing to baking/packaging – baked, packaged, quality-checked, and transferred to the cooler on Jan 25.
- Jan 26: 750 pie crusts (uncooked) transferred from mixing to baking/packaging – 500 baked, packaged, quality-checked, and transferred to the cooler on Jan 31, leaving 250 pie crusts 20% through the process.
- All direct materials in this combined department (packing materials) are added at the end of the process, so the 250 shells remaining in work-in-process on January 31 are 0% complete as to direct materials.
- Costs accumulated in the accounting records are:
- $600 in direct materials
- $4,100 in labor, factory overhead, and other conversion costs.
Let’s put together a Production Cost Report one step at a time.
Step 1 – Calculate Units to Account For
Establish the total inventory in production by adding units started into production to beginning work in process (what was left only partially finished at the end of the prior month). For this example, we will assume that all pie shells in process were completed in December and the facility was shut down over the holiday break for annual repairs, maintenance, and deep cleaning. So, the beginning inventory of zero plus the 2,250 pie shells transferred in from the mixing department during the month gives us a total number of units to account for of 2,250.
| UNITS | Physical Units |
|---|---|
| Subcategory, Units to account for: | Single Line |
| Beginning work-in-process | 0 |
| Transferred in from mixing | 2,250 |
| Total units to account for | Single Line2,250Double line |
Step 2 – Calculate Units Accounted For
In subsequent departments like these, the units are then broken down into three categories: transferred in, direct materials, and conversion costs. The 2,000 units that have been transferred out are 100% complete, so the Equivalent Units and the actual physical units are the same. However, unfinished units (work-in-process) in this department have to be converted to Equivalent Units. In this case, since materials are all added at the end of the process, the Equivalent Units for Direct Materials is 0% of the actual units, but the Equivalent Units for the Conversion Costs allocation is 20% of actual units or 50 EUs.
From our assumptions: Jan 26: 750 pie crusts (uncooked) and transferred from mixing to baking/packaging – 500 baked, packaged, quality-checked, and transferred to the cooler on Jan 31, leaving 250 pie crusts 20% through the process. 250 * 0.20 = 50 EUs.
| Equivalent Units | ||||
| Physical Units | Single LineTransferred In | Single LineDirect Materials | Single LineConversion Costs | |
| Subcategory, Units accounted for: | Single Line | Single Line | Single Line | Single Line |
| Completed and transferred out | 2,000 | 2,000 | 2,000 | 2,000 |
| Ending work-in-process | 250 | 250 | 0 | 50 |
| Total units accounted for | Single Line2,250Double line | Single Line2,250Double line | Single Line2,000Double line | Single Line2,050Double line |
Remember, Equivalent Units will be used to come up with an overall allocation rate that will then be used to allocate total costs between products completed and transferred out and products still in the process.
Step 3 – Divide Total Costs by Equivalent Units
From the accounting records, we see that total direct materials used in January by the baking/packaging department were $600 and direct labor and manufacturing overhead totaled $4,100. We divided those amounts by the related Equivalent Units to come up with a cost per EU.
| Transferred In | Direct Materials | Conversion Costs | Total Costs | |
|---|---|---|---|---|
| Subcategory, Costs to account for: | ||||
| Beginning work-in-process | $ – | $ – | $ – | $ – |
| Costs added during the period | $ 4,950 | $ 600 | $ 4,100 | $ 9,650 |
| Total costs to account for | Single Line$ 4,950 | Single Line$ 600 | Single Line$ 4,100 | Single Line$ 9,650Double line |
| Divided by: Total EUP | 2,250 | 2,000 | 2,050 | |
| Cost per equivalent unit | Single Line$ 2.20Double line | Single Line$ 0.30Double line | Single Line$ 2.00Double line | |
Notice that the “Transferred In” column comes right from the mixing department Production Cost Report.
Total costs of $9,650 are the $4,950 transferred in from the mixing department plus the $4,700 incurred in baking and packaging.
Step 4 – Allocate Costs Based on Equivalent Units
Refer back to step 2:
| Equivalent Units | ||||
| Physical Units | Single LineTransferred In | Single LineDirect Materials | Single LineConversion Costs | |
| Subcategory, Units accounted for: | Single Line | Single Line | Single Line | Single Line |
| Completed and transferred out | 2,000 | 2,000 | 2,000 | 2,000 |
| Ending work-in-process | 250 | 250 | 0 | 50 |
| Total units accounted for | Single Line2,250Double line | Single Line2,250Double line | Single Line2,000Double line | Single Line2,050Double line |
Multiply the cost per equivalent unit by the number of equivalent units for each category of units accounted for: Completed and transferred out, and Ending work-in-process.
Completed and transferred out
| Transferred In | Direct Materials | Conversion Costs | Total Costs | |
|---|---|---|---|---|
| Equivalent units completed and transferred out | Single Line2,000 | Single Line2,000 | Single Line2,000 | |
| Cost per equivalent unit | $ 2.20 | $ 0.30 | $ 2.00 | |
| Cost allocated to completed units | Single Line$ 4,400Double line | Single Line$ 600Double line | Single Line$ 4,000Double line | Single Line$ 9,000Double line |
Ending work-in-process
| Transferred In | Direct Materials | Conversion Costs | Total Costs | ||
|---|---|---|---|---|---|
| Equivalent units not yet completed | Single Line250 | Single Line0 | Single Line50 | ||
| Cost per equivalent unit | $ 2.20 | $ 0.30 | $ 2.00 | ||
| Cost allocated to work-in-process | Single Line$550Double line | Single Line$ 00Double line | Single Line$ 100Double line | Single Line$ 650Double line |
Notice that under this Equivalent Units method of allocating costs, no direct materials were allocated to ending work in process because the EUs were zero. However, because we are using the average method instead of the First-in, First-out (FIFO) method, which uses the assumption that the flow of goods through the system is a constant mix, we still have costs left in the “transferred in” column. Using a FIFO cost-flow assumption, we would have allocated those costs to finished goods first.
Before we examine the FIFO method, let’s complete the production cost report for this department and check your understanding of how subsequent departments differ from the first department.
Complete the Production Report
| Equivalent Units | |||||
| Subcategory, UNITS | Physical Units | Single LineTransferred In | Single LineDirect Materials | Single LineConversion Costs | |
| Subcategory, Units to account for: | Single Line | Single Line | Single Line | Single Line | |
| Beginning work-in-process | 0 | ||||
| Transferred in from mixing | 2,250 | ||||
| Total units to account for | Single Line2,250Double line | ||||
| Subcategory, Units accounted for: | |||||
| Completed and transferred out | 2,000 | 2,000 | 2,000 | 2,000 | |
| Ending work-in-process | 250 | 250 | 0 | 50 | |
| Total units accounted for | Single Line2,250Double line | Single Line2,250Double line | Single Line2,000Double line | Single Line2,050Double line | |
| COSTS | Transferred In | Direct Materials | Conversion Costs | Total Costs | |
| Subcategory, Costs to account for: | Single Line | Single Line | Single Line | Single Line | |
| Beginning work-in-process | $ – | $ – | $ – | $ – | |
| Costs added during the period | $ 4,950 | $ 600 | $ 4,100 | $ 9,650 | |
| Total costs to account for | Single Line$ 4,950 | Single Line$ 600 | Single Line$ 4,100 | Single Line$ 9,650Double line | |
| Divided by: Total EUP | 2,250 | 2,000 | 2,050 | ||
| Cost per equivalent unit | Single Line$ 2.20Double line | Single Line$ 0.30Double line | Single Line$ 2.00Double line | ||
| Subcategory, Costs accounted for: | |||||
| Completed and transferred out | $ 4,400 | $ 600 | $ 4,000 | $ 9,000 | |
| Ending work-in-process | $ 550 | $ – | $ 100 | $ 650 | |
| Total costs accounted for | Single Line$ 4,950Double line | Single Line$ 600Double line | Single Line$ 4,100Double line | Single Line$ 9,650Double line | |
And here is a summary of total inventory at the end of January based on the two production reports:
| Description | Amount | Total |
|---|---|---|
| Subcategory, Inventory | ||
| Work-in-process | ||
| Mixing | $ 1,290 | |
| Baking/Packaging | 650 | $ 1,940 |
| Finished Goods | Single Line | 9,000 |
| Total Inventory | Single Line$ 10,940Double line | |
Thus, all the costs from both departments are accounted for and allocated to the proper category.
| Description | Total |
|---|---|
| Mixing Department | $ 6,240 |
| Baking/Packaging Department | 4,700 |
| Total costs to be allocated | Single Line$ 10,940Double line |
Now, check your understanding of the second or subsequent stage of a multi-step process using the weighted-average method of process costing.
Practice Question
Candela Citations
- Production Report - Subsequent Department - Weighted Average. Authored by: Joseph Cooke. Provided by: Lumen Learning. License: CC BY: Attribution
