1.1 Section Exercises
Verbal
1. What is the difference between a relation and a function?
2. What is the difference between the input and the output of a function?
3. Why does the vertical line test tell us whether the graph of a relation represents a function?
4. How can you determine if a relation is a one-to-one function?
5. Why does the horizontal line test tell us whether the graph of a function is one-to-one?
Algebraic
For the following exercises, determine whether the relation represents a function.
6. [latex]\left\{\left(a,b\right),\text{ }\left(c,d\right),\text{ }\left(a,c\right)\right\}[/latex]
7. [latex]\left\{\left(a,b\right),\left(b,c\right),\left(c,c\right)\right\}[/latex]
For the following exercises, determine whether the relation represents[latex]\text{ }y\text{ }[/latex]as a function of[latex]\text{ }x.\text{ }[/latex]
8. [latex]5x+2y=10[/latex]
9. [latex]y={x}^{2}[/latex]
10. [latex]x={y}^{2}[/latex]
11. [latex]3{x}^{2}+y=14[/latex]
12. [latex]2x+{y}^{2}=6[/latex]
13. [latex]y=-2{x}^{2}+40x[/latex]
14. [latex]y=\frac{1}{x}[/latex]
15. [latex]x=\frac{3y+5}{7y-1}[/latex]
16. [latex]x=\sqrt{1-{y}^{2}}[/latex]
17. [latex]y=\frac{3x+5}{7x-1}[/latex]
18. [latex]{x}^{2}+{y}^{2}=9[/latex]
19. [latex]2xy=1[/latex]
20. [latex]x={y}^{3}[/latex]
21. [latex]y={x}^{3}[/latex]
22. [latex]y=\sqrt{1-{x}^{2}}[/latex]
23. [latex]x=±\sqrt{1-y}[/latex]
24. [latex]y=±\sqrt{1-x}[/latex]
25. [latex]{y}^{2}={x}^{2}[/latex]
26. [latex]{y}^{3}={x}^{2}[/latex]
For the following exercises, evaluate the function[latex]\text{ }f\text{ }[/latex]at the indicated values[latex]\text{ }f\left(-3\right),f\left(2\right),f\left(-a\right),-f\left(a\right),f\left(a+h\right).[/latex]
27. [latex]f\left(x\right)=2x-5[/latex]
28. [latex]f\left(x\right)=-5{x}^{2}+2x-1[/latex]
29. [latex]f\left(x\right)=\sqrt{2-x}+5[/latex]
30. [latex]f\left(x\right)=\frac{6x-1}{5x+2}[/latex]
31. [latex]f\left(x\right)=|x-1|-|x+1|[/latex]
32. Given the function[latex]\text{ }g\left(x\right)=5-{x}^{2},\text{ }[/latex]evaluate[latex]\text{ }\frac{g\left(x+h\right)-g\left(x\right)}{h},\text{ }h\ne 0.[/latex]
33. Given the function[latex]\text{ }g\left(x\right)={x}^{2}+2x,\text{ }[/latex]evaluate[latex]\text{ }\frac{g\left(x\right)-g\left(a\right)}{x-a},\text{ }x\ne a.[/latex]
34. Given the function[latex]\text{ }k\left(t\right)=2t-1:[/latex]
- Evaluate[latex]\text{ }k\left(2\right).[/latex]
- Solve[latex]\text{ }k\left(t\right)=7.[/latex]
35. Given the function[latex]\text{ }f\left(x\right)=8-3x:[/latex]
- Evaluate[latex]\text{ }f\left(-2\right).[/latex]
- Solve[latex]\text{ }f\left(x\right)=-1.[/latex]
36. Given the function[latex]\text{ }p\left(c\right)={c}^{2}+c:[/latex]
- Evaluate[latex]\text{ }p\left(-3\right).[/latex]
- Solve[latex]\text{ }p\left(c\right)=2.[/latex]
37. Given the function[latex]\text{ }f\left(x\right)={x}^{2}-3x:[/latex]
- Evaluate[latex]\text{ }f\left(5\right).[/latex]
- Solve[latex]\text{ }f\left(x\right)=4.[/latex]
38. Given the function[latex]\text{ }f\left(x\right)=\sqrt{x+2}:[/latex]
- Evaluate[latex]\text{ }f\left(7\right).[/latex]
- Solve[latex]\text{ }f\left(x\right)=4.[/latex]
39. Consider the relationship[latex]\text{ }3r+2t=18.[/latex]
- Write the relationship as a function[latex]\text{ }r=f\left(t\right).[/latex]
- Evaluate[latex]\text{ }f\left(-3\right).[/latex]
- Solve[latex]\text{ }f\left(t\right)=2.[/latex]
Graphical
For the following exercises, use the vertical line test to determine which graphs show relations that are functions.


52. Given the following graph,
- Evaluate[latex]\text{ }f\left(-1\right).[/latex]
- Solve for[latex]\text{ }f\left(x\right)=3.[/latex]

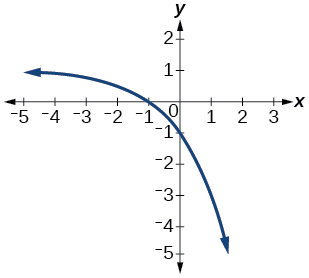
53. Given the following graph,
- Evaluate[latex]\text{ }f\left(0\right).[/latex]
- Solve for[latex]\text{ }f\left(x\right)=-3.[/latex]

54. Given the following graph,
- Evaluate[latex]\text{ }f\left(4\right).[/latex]
- Solve for[latex]\text{ }f\left(x\right)=1.[/latex]

For the following exercises, determine if the given graph is a one-to-one function.


Numeric
For the following exercises, determine whether the relation represents a function.
60. [latex]\left\{\left(-1,-1\right),\left(-2,-2\right),\left(-3,-3\right)\right\}[/latex]
61. [latex]\left\{\left(3,4\right),\left(4,5\right),\left(5,6\right)\right\}[/latex]
62. [latex]\left\{\left(2,5\right),\left(7,11\right),\left(15,8\right),\left(7,9\right)\right\}[/latex]
For the following exercises, determine if the relation represented in table form represents[latex]\text{ }y\text{ }[/latex]as a function of[latex]\text{ }x.[/latex]
63.
| [latex]x[/latex] | 5 | 10 | 15 |
| [latex]y[/latex] | 3 | 8 | 14 |
64.
| [latex]x[/latex] | 5 | 10 | 15 |
| [latex]y[/latex] | 3 | 8 | 8 |
65.
| [latex]x[/latex] | 5 | 10 | 10 |
| [latex]y[/latex] | 3 | 8 | 14 |
For the following exercises, use the function[latex]\text{ }f\text{ }[/latex]represented in (Figure).
| [latex]x[/latex] | [latex]f\left(x\right)[/latex] |
| 0 | 74 |
| 1 | 28 |
| 2 | 1 |
| 3 | 53 |
| 4 | 56 |
| 5 | 3 |
| 6 | 36 |
| 7 | 45 |
| 8 | 14 |
| 9 | 47 |
66. Evaluate[latex]\text{ }f\left(3\right).[/latex]
67. Solve[latex]\text{ }f\left(x\right)=1.[/latex]
For the following exercises, evaluate the function[latex]\text{ }f\text{ }[/latex]at the values[latex]f\left(-2\right),\text{ }f\left(-1\right),\text{ }f\left(0\right),\text{ }f\left(1\right),[/latex]and[latex]\text{ }f\left(2\right).[/latex]
68. [latex]f\left(x\right)=4-2x[/latex]
69. [latex]f\left(x\right)=8-3x[/latex]
70. [latex]f\left(x\right)=8{x}^{2}-7x+3[/latex]
71. [latex]f\left(x\right)=3+\sqrt{x+3}[/latex]
72. [latex]f\left(x\right)=\frac{x-2}{x+3}[/latex]
73. [latex]f\left(x\right)={3}^{x}[/latex]
For the following exercises, evaluate the expressions, given functions[latex]f,\text{ }\text{ }g,[/latex]and[latex]\text{ }h:[/latex]
- [latex]f\left(x\right)=3x-2[/latex]
- [latex]g\left(x\right)=5-{x}^{2}[/latex]
- [latex]h\left(x\right)=-2{x}^{2}+3x-1[/latex]
74. [latex]3f\left(1\right)-4g\left(-2\right)[/latex]
75. [latex]f\left(\frac{7}{3}\right)-h\left(-2\right)[/latex]
Technology
For the following exercises, graph[latex]\text{ }y={x}^{2}\text{ }[/latex]on the given viewing window. Determine the corresponding range for each viewing window. Show each graph.
76. [latex]\left[-0.1,\text{ }0.1\right][/latex]
77. [latex]\left[-10,\text{ 10}\right][/latex]

78. [latex]\left[-100,100\right][/latex]
For the following exercises, graph[latex]\text{ }y={x}^{3}\text{ }[/latex]on the given viewing window. Determine the corresponding range for each viewing window. Show each graph.
79. [latex]\left[-0.1,\text{ 0}\text{.1}\right][/latex]

80. [latex]\left[-10,\text{ 10}\right][/latex]
81. [latex]\left[-100,\text{ 100}\right][/latex]

For the following exercises, graph[latex]\text{ }y=\sqrt{x}\text{ }[/latex]on the given viewing window. Determine the corresponding range for each viewing window. Show each graph.
82. [latex]\left[0,\text{ 0}\text{.01}\right][/latex]
83. [latex]\left[0,\text{ 100}\right][/latex]

84. [latex]\left[0,\text{ 10,000}\right][/latex]
For the following exercises, graph [latex]y=\sqrt[3]{x}[/latex] on the given viewing window. Determine the corresponding range for each viewing window. Show each graph.
85. [latex]\left[-0.001,\text{0.001}\right][/latex]

86. [latex]\left[-1000,\text{1000}\right][/latex]
87. [latex]\left[-1,000,000,\text{1,000,000}\right][/latex]

Real-World Applications
88. The amount of garbage,[latex]\text{ }G,\text{ }[/latex]produced by a city with population[latex]\text{ }p\text{ }[/latex]is given by[latex]\text{ }G=f\left(p\right).\text{ }[/latex][latex]G\text{ }[/latex]is measured in tons per week, and[latex]\text{ }p\text{ }[/latex]is measured in thousands of people.
- The town of Tola has a population of 40,000 and produces 13 tons of garbage each week. Express this information in terms of the function[latex]\text{ }f.\text{ }[/latex]
- Explain the meaning of the statement[latex]\text{ }f\left(5\right)=2.[/latex]
89. The number of cubic yards of dirt,[latex]\text{ }D,\text{ }[/latex]needed to cover a garden with area[latex]\text{ }a\text{ }[/latex]square feet is given by[latex]\text{ }D=g\left(a\right).[/latex]
- A garden with area 5000 ft2 requires 50 yd3 of dirt. Express this information in terms of the function[latex]\text{ }g.[/latex]
- Explain the meaning of the statement[latex]\text{ }g\left(100\right)=1.[/latex]
90. Let[latex]\text{ }f\left(t\right)\text{ }[/latex]be the number of ducks in a lake[latex]\text{ }t\text{ }[/latex]years after 1990. Explain the meaning of each statement:
- [latex]f\left(5\right)=30[/latex]
- [latex]f\left(10\right)=40[/latex]
91. Let[latex]\text{ }h\left(t\right)\text{ }[/latex]be the height above ground, in feet, of a rocket[latex]\text{ }t\text{ }[/latex]seconds after launching. Explain the meaning of each statement:
- [latex]h\left(1\right)=200[/latex]
- [latex]h\left(2\right)=350[/latex]
92. Show that the function[latex]\text{ }f\left(x\right)=3{\left(x-5\right)}^{2}+7\text{ }[/latex]is not one-to-one.