Learning outcomes
- Describe demography and the main demographic measurements used to project population growth
- Describe demographic theories—Malthusian, cornucopian, zero population growth, and demographic transition theories
- Describe patterns and issues surrounding immigration to the United States
Scholars understand demography through various analyses—Malthusian theory, Zero population growth, cornucopian theory, and demographic transition theory all help sociologists study demography. The earth’s human population has doubled in the past 43 years, especially in peripheral countries, and some are concerned that we will not have enough food and other resources to sustain the expanding population. Factors that impact population include birthrates, mortality rates, and migration, this last a term that includes immigration (entering a country to live permanently) and emigration (leaving a country).

Figure 1. The population in some countries, particularly India, Pakistan, and much of Africa, will increase tremendously in coming years.
There are numerous potential outcomes of the growing population, and sociological perspectives vary in their findings regarding the potential effect of these increased numbers. From any point of view, it seems clear that the growth will put additional pressure the already taxed planet and its finite natural resources.
Demography and Population Growth

Figure 2. At over 7 billion, Earth’s population is always on the move. (Photo courtesy of David Sim/flickr)
Between 2011 and 2012, we reached a population milestone of seven billion humans on the earth’s surface. The rapidity with which this happened demonstrated an exponential increase from the time it took to grow from five billion to six billion people. In short, the planet is filling up. How quickly will we go from seven billion to eight billion? How will that population be distributed? Where is population the highest? Where is it slowing down? Where will people live? To explore these questions, we turn to demography, or the study of populations. Three of the most important components that affect the issues above are fertility, mortality, and migration.
The fertility rate of a society is a measure noting the number of children born. The fertility number is generally lower than the fecundity rate, which measures the potential number of children that could be born to women of childbearing age. Sociologists measure fertility using the crude birthrate (the number of live births per 1,000 people per year). Just as fertility measures childbearing, the mortality rate is a measure of the number of people who die. The crude death rate is a number derived from the number of deaths per 1,000 people per year. When analyzed together, fertility and mortality rates help researchers understand the overall growth occurring in a population.
Another key element in studying populations is the movement of people into and out of an area. Migration may take the form of immigration, which describes movement into an area to take up permanent residence, or emigration, which refers to movement out of an area to another place of permanent residence. Migration might be voluntary (as when college students study abroad), involuntary (as when Syrians evacuated war-torn areas), or forced (as when many Native American tribes were removed from the lands they’d lived in for generations).
The 2014 Child Migration Crisis
Children have always contributed to the total number of migrants crossing the southern border of the United States illegally, but in 2014, a steady overall increase in unaccompanied minors from Central America reached crisis proportions when tens of thousands of children from El Salvador, Guatemala, and Honduras crossed the Rio Grande and overwhelmed border patrols and local infrastructure (Dart, 2014).
Since legislators passed the William Wilberforce Trafficking Victims Protection Reauthorization Act of 2008 in the last days of the Bush administration, unaccompanied minors from countries that do not share a border with the United States are guaranteed a hearing with an immigration judge where they may request asylum based on a “credible” fear of persecution or torture (U.S. Congress, 2008). In some cases, these children are looking for relatives and can be placed with family while awaiting a hearing on their immigration status; in other cases they are held in processing centers until the Department of Health and Human Services makes other arrangements (Popescu, 2014).
The 2014 surge placed such a strain on state resources that Texas began transferring the children to Immigration and Naturalization facilities in California and elsewhere, without incident for the most part. On July 1, 2014, however, buses carrying the migrant children were blocked by protesters in Murrietta, California, who chanted, “Go home” and “We don’t want you.” (Fox News and Associated Press, 2014; Reyes, 2014).
Given the fact that these children are fleeing various kinds of violence and extreme poverty, how should the U.S. government respond? Should the government pass laws granting a general amnesty? Or should it follow a zero-tolerance policy, automatically returning any and all unaccompanied minor migrants to their countries of origin so as to discourage additional immigration that will stress the already overwhelmed system?
A functional perspective theorist might focus on the systemic dysfunctions caused by the sudden influx of underage asylum seekers, while a conflict perspective theorist might look at the way social stratification influences how the members of a developed country are treating the lower-status migrants from less-developed countries in Latin America. An interactionist theorist might see significance in the attitudes and shared understandings of the Murrietta protesters regarding the migrant children. Which theoretical perspective makes the most sense to you?
Population Growth
Changing fertility, mortality, and migration rates make up the total population composition, a snapshot of the demographic profile of a population. This number can be measured for societies, nations, world regions, or other groups. The population composition includes the sex ratio, the number of men for every hundred women, as well as the population pyramid, a picture of population distribution by sex and age.

Figure 3. This population pyramid shows the estimated U.S. population broken down by sex and years of age as of July 1 2107
| Varying Fertility and Mortality Rated by Country | ||||
|---|---|---|---|---|
| Country | Population (in millions) | Fertility Rate | Mortality Rate | Sex Ratio Male to Female |
| Afghanistan | 35 | 5.12% | 13.2% | 1.03 |
| Sweden | 10 | 1.88% | 9.4% | 1 |
| United States of America | 329 | 1.87% | 8.2% | .97 |
Comparing the three countries in the table above reveals that there are more men than women in Afghanistan, whereas the reverse is true in Sweden and the United States. Afghanistan also has significantly higher fertility and mortality rates than either of the other two countries. Do these statistics surprise you? How do you think the population makeup affects the political climate and economics of the different countries?
Think It Over
- Given what we know about population growth, what do you think of China’s policies that limit the number of children a family can have? Do you agree with it? Why, or why not? What other ways might a country of over 1.3 billion people manage its population?
- Describe the effect of immigration or emigration on your life or in a community you have seen. What are the positive effects? What are the negative effects?
- What responsibility does the United States have toward underage asylum-seekers?
Demographic Theories
Sociologists have long looked at population issues as central to understanding human interactions. Understanding population growth gives us some insight on how many schools, homes, hospitals and even prisons we need to build, as well as other economic factors that impact societies. Below we will look at four theories about population that inform sociological thought: Malthusian, zero population growth, cornucopian, and demographic transition theories.
Malthusian Theory
Thomas Malthus (1766–1834) was an English clergyman who made dire predictions about earth’s ability to sustain its growing population. According to Malthusian theory, three factors would control human population that exceeded the earth’s carrying capacity, or how many people can live in a given area considering the amount of available resources. Malthus identified these factors as war, famine, and disease (Malthus, 1798). He termed them “positive checks” because they increase mortality rates, thus keeping the population in check. They are countered by “preventive checks,” which also control the population but by reducing fertility rates; preventive checks include birth control and celibacy. Thinking practically, Malthus saw that people could produce only so much food in a given year, yet the population was increasing at an exponential rate. Eventually, he thought people would run out of food and begin to starve. They would go to war over increasingly scarce resources and reduce the population to a manageable level, and then the cycle would begin anew.
Watch the following video about Malthus’ Essay on the Principle of Population to learn more about his theory.
https://www.youtube.com/watch?v=R_Mw0WEbqrI
Of course, this has not exactly happened. The human population has continued to grow well beyond Malthus’s predictions. So what happened? Why didn’t we die off? There are three reasons sociologists believe we are continuing to expand the population of our planet. First, technological increases in food production have increased both the amount and quality of calories we can produce per person. Second, human ingenuity has developed new medicine to curtail death from disease. Finally, the development and widespread use of contraception and other forms of family planning have decreased the speed at which our population increases. But what about the future? Some still believe Malthus was correct and that ample resources to support the earth’s population will soon run out.
Zero Population Growth
A neo-Malthusian researcher named Paul Ehrlich brought Malthus’s predictions into the twentieth century. However, according to Ehrlich, it is the environment, not specifically the food supply, that will play a crucial role in the continued health of planet’s population (Ehrlich 1968). Ehrlich’s ideas suggest that the human population is moving rapidly toward complete environmental collapse, as privileged people use up or pollute a number of environmental resources such as water and air. He advocated for a goal of zero population growth (ZPG), in which the number of people entering a population through birth or immigration is equal to the number of people leaving it via death or emigration. While support for this concept is mixed, it is still considered a possible solution to global overpopulation.
Further Research
To learn more about population concerns, from the new-era ZPG advocates to the United Nations reports, check out Population Connection and the UN Population Division.
Cornucopian Theory
Of course, some theories are less focused on the pessimistic hypothesis that the world’s population will meet a detrimental challenge to sustaining itself. Cornucopian theory scoffs at the idea of humans wiping themselves out; it asserts that human ingenuity can resolve any environmental or social issues that develop. As an example, it points to the issue of food supply. If we need more food, the theory contends, agricultural scientists will figure out how to grow it, as they have already been doing for centuries. (A “cornucopia” is a horn-shaped container overflowing with sources of nourishment; it traditionally symbolizes abundance.) After all, in this perspective, human ingenuity has been up to the task for thousands of years and there is no reason for that pattern not to continue (Simon, 1981).
Demographic Transition Theory
Whether you believe that we are headed for environmental disaster and the end of human existence as we know it, or you think people will always adapt to changing circumstances, we can see clear patterns in population growth. Societies develop along a predictable continuum as they evolve from unindustrialized to postindustrial. Demographic transition theory (Caldwell and Caldwell, 2006) suggests that future population growth will develop along a predictable four-stage (sometimes five-stage) model.
In Stage 1, birth, death, and infant mortality rates are all high, while life expectancy is short. An example of this stage is the 1800s in the United States. As countries begin to industrialize, they enter Stage 2, where birthrates are higher while infant mortality and the death rates drop. Life expectancy also increases. Afghanistan is currently in this stage. Stage 3 occurs once a society is thoroughly industrialized; birthrates decline, while life expectancy continues to increase. Death rates continue to decrease. Mexico’s population is at this stage. In the final phase, Stage 4, we see the postindustrial era of a society. Birth and death rates are low, people are healthier and live longer, and society enters a phase of population stability. Overall population may even decline. For example, Sweden is considered to be in Stage 4. Some scholars have added Stage 5, suggesting another stage when fertility either remains below replacement levels, or begins to rise slowly again.

Figure 4. This shows how the changes in birth and death rates affect total population during the demographic transition stages.
The United Nations Population Fund (2008) categorizes nations as high fertility, intermediate fertility, or low fertility. The United Nations (UN) anticipates the population growth will triple between 2011 and 2100 in high-fertility countries, which are currently concentrated in sub-Saharan Africa.
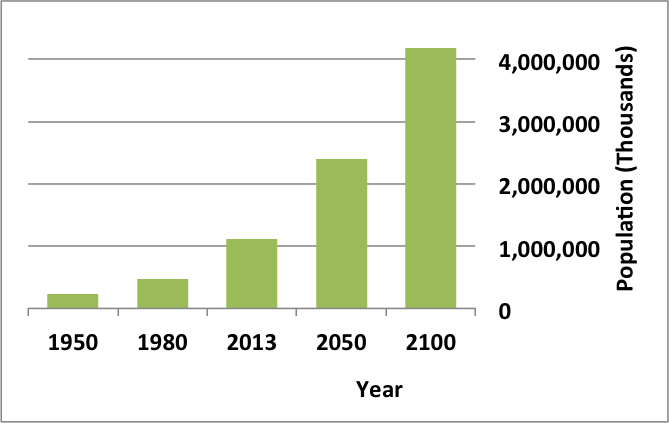
Figure 5. Projected Population in Africa: This graph shows the population growth of countries located on the African continent, many of which have high fertility rates. (Graph courtesy of USAID)
For countries with intermediate fertility rates (the United States, India, and Mexico all fall into this category), growth is expected to be about 26 percent.

Figure 6. Projected Population in the United States: The United States has an intermediate fertility rate, and therefore, a comparatively moderate projected population growth. (Graph courtesy of USAID)
And low-fertility countries like China, Australia, and most of Europe will actually see population declines of approximately 20 percent.

Figure 7. Projected Population in Europe: This chart shows the projected population growth of Europe for the remainder of this century. (Graph courtesy of USAID)
Immigration in the United States
Changes in U.S. Immigration Patterns and Attitudes
Worldwide patterns of migration have changed, though the United States remains the most popular destination. In 2016, there were over 43.7 million immigrants living in the United States, constituting 13.5 percent of the population. This is more than four times the number of the 9.7 million immigrants in the United States in 1960.[2] From 1990 to 2013, the number of migrants living in the United States increased from one in six to one in five (The Pew Research Center 2013). Overall, in 2013 the United States was home to about 46 million foreign-born people, while only about 3 million U.S. citizens lived abroad. Of foreign-born citizens emigrating to the United States, over 50 percent originated in Latin America and the Caribbean, and 26.7 percent come from South or East Asia.[3]

Figure 8. In 2015, there were 12.1 million immigrants to the United States from South or East Asia, 11.6 million from Mexico, and 5.6 million from Canada or Europe. Note how these percentages have changed in recent years.
While there are more foreign-born people residing in the United States legally (76% of immigrants in 2016), about 10.7 million are unauthorized immigrants. This is a 13% decline from a peak of 12.2 million in 2007. This decline is the result of less immigration from Mexico, even with rising immigration from other Central American countries. A growing number of unauthorized immigrants entered the country legally and are now considered illegal due to overstaying their visas.[4]
Most citizens agree that our national immigration policies are in need of major adjustment—almost three-quarters of those in a recent national survey believed illegal immigrants should have a path to citizenship provided they meet other requirements, such as speaking English or paying restitution for the time they spent in the country illegally. Interestingly, 55 percent of those surveyed who identified as Hispanic think a pathway to citizenship is of secondary importance to provisions for living legally in the United States without the threat of deportation (The Pew Research Center, 2013). Even more recently, partisan politics have people in the United States deeply divided about the importance of addressing illegal immigration, particularly along the U.S. Southern border with Mexico. President Donald Trump was elected in 2016 with the promise to build a wall along the border, but despite efforts to fund the building of the wall (and a government shutdown as the result of it), there are no immediate plans to construct a wall along the entire border, instead money has been designated to repair and add particular sections to existing border walls and fences.
Managing Refugees and Asylum-Seekers in the Modern World
In 2013, the number of refugees, asylum-seekers, and internally displaced people worldwide exceeded 50 million people for the first time since the end of World War II. Half these people were children. A refugee is defined as an individual who has been forced to leave his or her country in order to escape war, persecution, or natural disaster, while asylum-seekers are those whose claim to refugee status has not been validated. Asylum has two basic requirements. First, an asylum applicant must establish that he or she fears persecution in their home country. Second, the applicant must prove that he or she would be persecuted on account of one of five protected grounds: race, religion, nationality, political opinion, or particular social group. An internally displaced person, on the other hand, is neither a refugee nor an asylum-seeker. Displaced persons have fled their homes while remaining inside their country’s borders. The number of displaced persons and refugees who fall under the jurisdiction of the United Nations High Commissioner for Refugees (UNHCR) in 2015 was 57.9 million, up from 21 million in 2007.
The war in Syria caused most of the 2013 increase, forcing 2.5 million people to seek refugee status while internally displacing an additional 6.5 million. Violence in Central African Republic and South Sudan also contributed a large number of people to the total (The United Nations Refugee Agency, 2014). Refugees need help in the form of food, water, shelter, and medical care, which has worldwide implications for nations contributing foreign aid, the nations hosting the refugees, and the non-government organizations (NGOs) working with individuals and groups on site (The United Nations Refugee Agency, 2014).

Figure 9. A global concern is the falling rates of refugee resettlement, yet the rising number of refugees.
The United States recognizes the right of asylum for individuals as specified by international and federal law. A specified number of legally defined refugees who either apply for asylum from inside the U.S. or apply for refugee status from outside the U.S., are admitted annually. Refugees compose about one-tenth of the total annual immigration to the United States, though some large refugee populations are very prominent. Since World War II, more refugees have found homes in the U.S. than any other nation and more than two million refugees have arrived in the U.S. since 1980. This number is declining, however, as 2017 marked the first year that the U.S. resettled fewer refugees than the rest of the world. In 2017, the U.S. resettled about 33,000 refugees, which is a dramatic decrease from the 97,000 resettled in the United States in 2016. Other countries are also limiting the number of refugee resettlements, which is especially problematic since the number of refugees is on the rise.[5]
Visit this fact sheet from the National Immigration Forum to learn more about the process of seeking asylum: https://immigrationforum.org/article/fact-sheet-u-s-asylum-process/.
GLOSSARY
- asylum-seekers:
- those whose claim to refugee status have not been validated
- carrying capacity:
- the amount of people that can live in a given area considering the amount of available resources
- cornucopian theory:
- a theory that asserts human ingenuity will rise to the challenge of providing adequate resources for a growing population
- demographic transition theory:
- a theory that describes four stages of population growth, following patterns that connect birth and death rates with stages of industrial development
- demography:
- the study of population
- fecundity rate:
- potential number of children that could be born to women of childbearing age
- fertility rate:
- a measure noting the actual number of children born
- internally displaced person:
- someone who fled his or her home while remaining inside the country’s borders
- Malthusian theory:
- a theory, associated with English clergyman Thomas Malthus, asserting that population is controlled through positive checks (war, famine, disease) and preventive checks (measures to reduce fertility such as birth control or celibacy) zero population growth a theoretical goal in which the number of people entering a population through birth or immigration is equal to the number of people leaving it via death or emigration
- mortality rate:
- a measure of the number of people in a population who die
- population composition:
- a snapshot of the demographic profile of a population based on fertility, mortality, and migration rates
- population pyramid:
- a graphic representation that depicts population distribution according to age and sex
- refugee:
- an individual who has been forced to leave their country in order to escape war, persecution, or natural disaster
- sex ratio:
- the ratio of men to women in a given population
Candela Citations
- Introduction to Demography and Population Growth. Provided by: Lumen Learning. License: CC BY: Attribution
- Modification, adaptation, and original content. Authored by: Rebecca Vonderhaar for Lumen Learning. Provided by: Lumen Learning. License: CC BY: Attribution
- Paragraph on asylum in the United States. Provided by: Wikipedia. Located at: https://en.wikipedia.org/wiki/Asylum_in_the_United_States. License: CC BY-SA: Attribution-ShareAlike
- Demography and Population. Authored by: OpenStax CNX. Located at: https://cnx.org/contents/AgQDEnLI@10.1:LPE0-fiO@3/Demography-and-Population. License: CC BY: Attribution. License Terms: Download for free at http://cnx.org/contents/02040312-72c8-441e-a685-20e9333f3e1d@3.49
- The demographic transition in five stages. Authored by: Max Roser. Provided by: Wikimedia. Located at: https://commons.wikimedia.org/wiki/File:Demographic-TransitionOWID.png. License: CC BY-SA: Attribution-ShareAlike
- Updated information on the number of displaced persons, United Nations High Commissioner for Refugees. Provided by: Wikipedia. Located at: https://en.wikipedia.org/wiki/United_Nations_High_Commissioner_for_Refugees. License: CC BY-SA: Attribution-ShareAlike
- World Population Data image. Authored by: Kaneda Oshiko, Charlotte Green, and Kaitlyn Patierno . Provided by: Population Reference Bureau. Located at: https://www.prb.org/2018-world-population-data-sheet-with-focus-on-changing-age-structures/. Project: PRB Projects 2.3 Billion More People Living on Earth by 2050. License: All Rights Reserved
- Americau2019s Age Profile Told through Population Pyramids. Authored by: Luke T. Rogers. Provided by: U.S. Census Bureau. Located at: https://www.census.gov/newsroom/blogs/random-samplings/2016/06/americas-age-profile-told-through-population-pyramids.html. License: All Rights Reserved
- An Introduction to Thomas Malthus' An Essay on the Principle of Population- Macat Economics Analysis. Provided by: Macat. Located at: https://www.youtube.com/watch?v=R_Mw0WEbqrI. License: Other. License Terms: Standard YouTube License
- Main Source Countries/Regions of Immigrant Population Image. Provided by: National Conference of State Legislature. Located at: http://Main%20Source%20Countries/Regions%20of%20Immigrant%20Population. Project: Snapshot of U.S. Immigration 2019. License: All Rights Reserved
- For the first time, U.S. resettles fewer refugees than the rest of the world, graph. Authored by: Phillip Connor and Jens Manuel Krogstad. Provided by: Pew Research Center. Located at: https://www.pewresearch.org/fact-tank/2018/07/05/for-the-first-time-u-s-resettles-fewer-refugees-than-the-rest-of-the-world/. License: All Rights Reserved
- [footnote]The World Factbook 2016-17. Washington, DC: Central Intelligence Agency, 2016. https://www.cia.gov/library/publications/the-world-factbook/index.html ↵
- Radford, Jynnah and Abby Budiman (September 2018). Facts on U.S. Immigrants, 2016 Statistical portrait of the foreign-born population in the United States. Pew Research Center. Retrieved from https://www.pewhispanic.org/2018/09/14/facts-on-u-s-immigrants/#2013-fb-population ↵
- Snapshot of U.S. Immigration 2019 (March 2019. National Conference of State Legislatures. Retrieved from http://www.ncsl.org/research/immigration/snapshot-of-u-s-immigration-2017.aspx#1. ↵
- Gramlich, John (January 2019). How Americans see illegal immigration, the border wall and political compromise. Pew Research Center. Retrieved from https://www.pewresearch.org/fact-tank/2019/01/16/how-americans-see-illegal-immigration-the-border-wall-and-political-compromise/. ↵
- Connor, Phillip and Jens Manuel Krogstad (July 2018). For the first time, U.S. resettled fewer refugees than the rest of the world. Pew Research Center. Retrieved from https://www.pewresearch.org/fact-tank/2018/07/05/for-the-first-time-u-s-resettles-fewer-refugees-than-the-rest-of-the-world/. ↵