Learning Objectives
- Recognize the logic behind a hypothesis test and how it relates to the P-value.
Example
Community College Students and Federal Student Loans

According to the Project on Student Debt, “at least one million community college students, one in 10 nationally, do not have access to federal student loans – the safest, most affordable way to borrow for college. A new issue brief from the Project on Student Debt finds that almost a quarter of all community colleges do not participate in federal loan programs, thereby forcing needy students to resort to riskier, more expensive options such as private student loans and credit cards” (Source: Project on Student Debt, Press release, April 17, 2008).
Is the proportion of community colleges that do not participate in federal loan programs less than 25%, as reported? Let’s conduct a hypothesis test to find out.
Step 1: Determine the Hypotheses.
- H0: The proportion of community colleges that do not participate in federal loan programs is 0.25.
- Ha: The proportion of community colleges that do not participate in federal loan programs is less than 0.25.
Step 2: Collect the data.
For the purposes of this example, imagine that we select a random sample of 80 community colleges from the over 1,100 community colleges in the United States. Of the 80, suppose that 16 do not participate in federal loan programs, so the sample proportion is 0.20.
Because this sample proportion is less than 0.25, it provides evidence in favor of the alternative hypothesis. But we anticipate that samples will vary when the null hypothesis is true. How much of a difference will make us doubt the null hypothesis? Do we have evidence strong enough to reject the null hypothesis and accept the alternative hypothesis?
Step 3: Assess the evidence.
To assess the evidence, we need to know how much variability to expect in random samples when the null hypothesis is true. We begin with the assumption that H0 is true. In this case, we assume that 25% of community colleges do not participate in the federal loan programs. We then determine how unusual the results of the sample are. We ask, If the proportion of all community colleges without federal loan programs is 0.25, what is the chance that the proportion in a random sample of 80 community colleges is 0.20 or less? Obviously, this probability depends on how much variability exists in random samples of this size from this population.
The probability of observing a sample proportion at least this small if the population proportion is 0.25 is approximately 0.15 (upcoming topics explain how to calculate this probability). This is the P-value. It tells us that if the population proportion is actually 0.25, we will see a sample proportion of 0.20 or less about 15% of the time in random sampling.
Note: The P-value is a conditional probability. The condition is the assumption that the null hypothesis is true – in this case, that the population proportion is 0.25.
Step 4: Conclusion.
Note that the P-value is fairly large, so it is not surprising to see a sample proportion of 0.20 or lower if the population proportion is 0.25. If we use a significance level of 0.05, the P-value is larger than 0.05, so the difference we observe between the sample proportion and the assumed population proportion is not statistically significant. Differences this large can be explained by chance. We fail to reject the null hypothesis. Here is our conclusion.
The data do not provide significant evidence that the proportion of community colleges without federal loan programs is less than 25%.
Note: The conclusion answers our original research question. It focuses on the claim that is the alternative hypothesis. It does not say “the null hypothesis is true.” We never accept the null hypothesis or state that it is true. When there is not enough evidence to reject H0, the conclusion will say, in essence, “that there is not enough evidence to support Ha.”
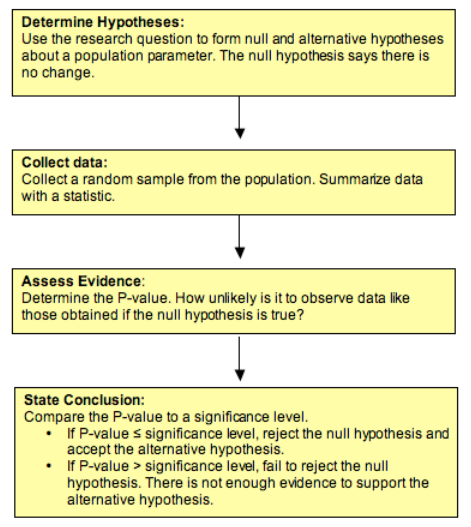
Summary
Now that we have seen two hypothesis tests, let’s summarize the steps:
Learn By Doing
The following two hypotheses are tested:
- H0: The proportion of U.S. adults who support gay marriage is roughly 50%.
- Ha: The proportion of U.S. adults who support gay marriage is above 50% (i.e., the majority support).
Suppose a survey was conducted in which a random sample of 1,100 U.S. adults were asked about their opinions on gay marriage, and based on the data, the P-value was found to be 0.002.
Comment: Throughout this activity, use a 0.05 (5%) significance level (cutoff).
Candela Citations
- Concepts in Statistics. Provided by: Open Learning Initiative. Located at: http://oli.cmu.edu. License: CC BY: Attribution