Learning Objectives
- Use a normal probability distribution to estimate probabilities and identify unusual events.
We now know that the empirical rule gives probabilities for values that lie exactly 1, 2, and 3 standard deviations away from the mean. But how do we determine the probability that a value lies some fraction of a standard deviation away from the mean? In this situation, we will use technology to find the probability.
For now, we use a simulation to find the probability based on a z-score. Statistical packages can also be used to find probabilities associated with a normal curve.
Example
The Distribution of z-Scores
Recall that we use the area under a normal density curve to find a probability. If we convert the x-values into z-scores, the distribution of z-scores is also a normal density curve. This curve is called the standard normal distribution.
Here we compare the normal density curve for the foot lengths to the standard normal curve:

The normal curve pictured on top is the model for the distribution of foot lengths. Note that the values on the axis are foot lengths. The distribution has a mean of 11 inches and a standard deviation of 1.5 inches. A foot length of 13 inches is marked. The shaded area is 0.0918. This is the probability that a randomly selected male will have a foot length greater than 13 inches: P(X > 13) = 0.0918.
The normal curve pictured on bottom is the standard normal distribution. This represents the distribution of z-scores. Note that the values on the axis are z-scores. The mean is 0 and the standard deviation is 1. The z-score corresponding to X = 13 inches is marked.
[latex]Z=\frac{x-\mathrm{μ}}{\mathrm{σ}}=\frac{13-11}{1.5}=1.33[/latex]
The shaded area here is the same, 0.0918. This is the probability that a z-score is greater than 1.33: P(Z > 1.33) = 0.0918.
Here is the main idea: Since the areas are the same, we use the standard normal curve to find the probabilities associated with any normal density curve.
Note: The standard normal distribution always has a mean = 0 and a standard deviation = 1. To understand this, recall that a z-score is the number of standard deviations X is above (or below) the mean.
- When the x-value is the mean, the z-score is 0.
- We can illustrate this for the foot lengths: If X is the mean, then
[latex]\begin{array}{l}X=11\\ Z=\frac{x-\mathrm{μ}}{\mathrm{σ}}=\frac{11-11}{1.5}=\frac{0}{1.5}=0\end{array}[/latex] - When X is 1 standard deviation above the mean, the z-score is 1.
- We can illustrate this for the foot lengths: If x-value is 1 standard deviation above the mean, X = 11 + 1.5 = 12.5.
[latex]Z=\frac{x-\mathrm{μ}}{\mathrm{σ}}=\frac{12.5-11}{1.5}=\frac{1.5}{1.5}=1[/latex] - Similarly, the z-score for the x-value that is 1 standard deviation below the mean is −1.
Example
Using the Standard Normal Curve to Find Probabilities
We use a simulation based on the standard normal distribution to find probabilities. In this simulation, the numbers on the horizontal axis are z-scores. The areas are rounded to four decimal places, so these areas are not exact values.

Use this image from the simulation to find the probabilities:
- Find P(−1.21 < Z < 1.21). In words, we want to find the probability that the z-score is between −1.21 and 1.21. This probability is the light blue area. So the answer is 0.7737.
- Find P(Z > 1.21). In words, we want to find the probability that the z-score is greater than 1.21. This probability is the blue area to the right of Z = 1.21. So the answer is 0.1131.
- Find P(Z < −1.21). In words, we want to find the probability that the z-score is less than −1.21. This probability is the dark blue area to the left of Z = −1.21. So the answer is 0.1131. Note that this is the same as P(Z > 1.21) because of the symmetry in the normal distribution. Both tails have the same area.
- Find P(Z > −1.21). In words, we want to find the probability that the z-score is greater than −1.21. This probability is the area to the right of −1.21. This is the sum of the green area and the dark blue area. So the answer is 0.7737 + 0.1131 = 0.8868.
Note: Here is another way to use the simulation to find P(Z > −1.21). Here we moved one slider as far to the left as possible, then located the other slider at Z = −1.21.
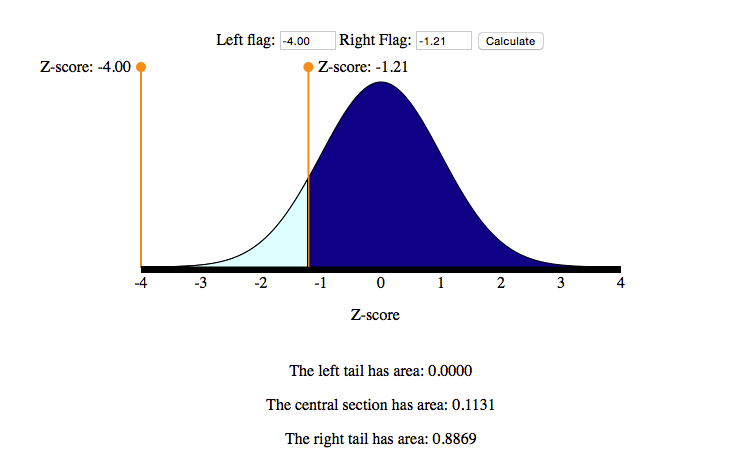
Notice that the area is 0.8869, not 0.8868. This discrepancy is due to rounding. The simulation uses a mathematical model to find the areas. These areas are rounded to four decimal places. Don’t worry about this small difference. Either answer is acceptable.
We now practice using the simulation based on the standard normal curve to find probabilities. Later we use this same simulation to find probabilities for any normal distribution.
Click here to open this simulation in its own window.
Learn By Doing
Click here to open the above simulation in its own window.
Learn By Doing
Candela Citations
- Concepts in Statistics. Provided by: Open Learning Initiative. Located at: http://oli.cmu.edu. License: CC BY: Attribution