Learning Objectives
- Use mean and standard deviation to describe a distribution.
What We Know So Far about the Standard Deviation
- The standard deviation is a measure of spread.
- The standard deviation is approximately the average distance of the data from the mean, so it is approximately equal to ADM.
- Mean ± SD gives a range of typical values.
- We will use technology to calculate the standard deviation.
Now we incorporate the standard deviation into our description of the pattern in the distribution of a quantitative variable. More specifically, we use standard deviation to compare the variability of two distributions.
Example
Backpack Weight
The following histograms show the backpack weight carried by two groups of schoolchildren. One is a group of first and third graders. The other is a group of fifth and seventh graders. In each histogram, we marked the mean and a standard deviation above the mean.
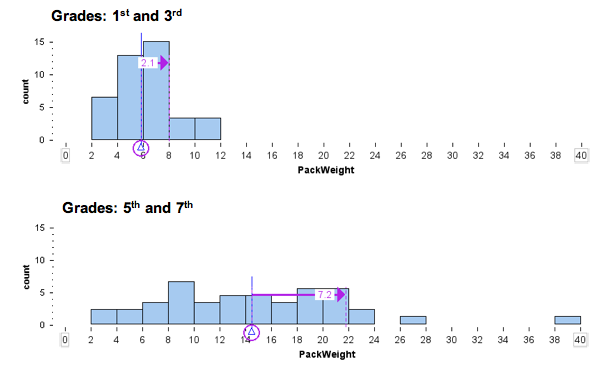
Following are some observations about shape, center and spread.
Note: For easy visual comparison, we made the histogram bin widths the same. This decision made the histogram of pack weights for the fifth and seventh graders a “pancake.” For this distribution, a larger bin width will give a more accurate sense of shape. However, since our goal is to compare the two groups, we chose to use the same scale and bin width for the histograms.
First and Third Graders
- Shape: The distribution appears somewhat symmetrical with a slight skew to the right.
- Center and spread: With the use of technology, we determined the mean is 5.8 pounds and the standard deviation is 2.1 pounds.
- Typical range of values: A stardard deviation either side of the mean gives a range of typical values: 5.8 − 2.1 = 3.7 and 5.8 + 2.1 = 7.9. So typical first and third graders are carrying between 3.7 and 7.9 pounds.
Fifth and Seventh Graders
- Shape and deviations from the pattern (outliers): The distribution appears somewhat uniform with two students who appear to be outliers.
- Center and spread: With the use of technology, we determined the mean is 14.2 pounds and the standard deviation is 7.2 pounds.
- Typical range of values: A standard deviation either side of the mean gives a range of typical values: 14.2 − 7.2 = 7.0 and 14.2 + 7.2 = 21.4. So typical fifth and seventh graders are carrying between 7.0 and 21.4 pounds.
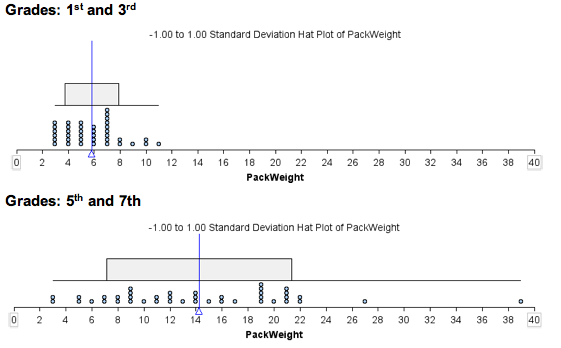
Here is another view of the same data. The SD hatplot marks a standard deviation above and below the mean, so the gray rectangle shows us the typical range of backpack weights that we calculated previously.
Next we summarize our observations with a focus on comparing the two groups:
From this analysis, we can see that the group of students in the fifth and seventh grades are carrying more weight on average in their backpacks. The mean weight for this group is 14.2 pounds compared to 5.8 pounds for the group of first and third graders. There is also more variability in backpack weights in the fifth- seventh-grade group. The standard deviation for this group is 7.2 pounds, compared to 2.1 pounds for the younger students.
If we use the standard deviation about the mean to identify typical backpack weights, we see that typical older students in this sample are carrying between 7 and 21.4 pounds, compared to typical younger students who are carrying between 3.7 and 7.9 pounds. This is consistent with what we might expect.
One plausible explanation is that as children get older, they are assigned more homework, so they carry more in their backpacks. But at this age, we may also see more students making independent decisions about how much homework they will do, so some students will carry more books home and others will carry fewer.
Learn By Doing
Consider the following two quantitative data sets:
- Set A: The times (in minutes) of all competitors in the 1,500-meter running track-and-field event at the most recent Olympic Games.
- Set B: The times (in minutes) of all competitors in the 1,500-meter running track-and-field event at all high school meets in the United States last year.
Can two data sets have the same mean but different standard deviations? Can two data sets have different means but the same standard deviation? Use the simulation to investigate these questions in the next two activities.
Instructions for adding or removing data points:
- To add a point, move the slider to the value you want, then click on the + sign.
- To remove a point, move the slider to the value you want, then click on the – sign.
- To reset the simulation, click the button in the upper left corner that says Reset.
Click here to open this simulation in its own window.
Activity 1
Learn By Doing
Activity 2
Learn By Doing
Remark:
The examples we constructed in the preceding activity should make it clear that the mean and standard deviation measure independent characteristics of a data set. The mean is a measure of center, and the standard deviation is a measure of spread. The size of the mean does not give us information about the size of the standard deviation. Similarly, the size of the standard deviation does not give us information about the size of the mean.
Candela Citations
- Concepts in Statistics. Provided by: Open Learning Initiative. Located at: http://oli.cmu.edu. License: CC BY: Attribution