We organized this course around the Big Picture of Statistics. As we learn new material, we will always look at how these new ideas relate to the Big Picture. In this way the Big Picture is a diagram that will help us organize and understand the material we will learn throughout the course.
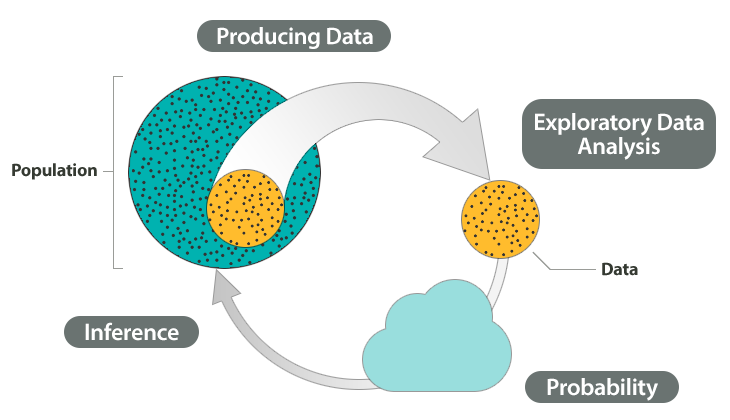
The Big Picture summarizes the steps in a statistical investigation.
We begin a statistical investigation with a research question. The research question is frequently something we want to know about a population. The population can be people or other things, such as animals or objects. For example, we might want to know the answer to questions such as:
- What percentage of U.S. adults supports the death penalty? (Population: U.S. adults)
- Do cell phones affect bees? (Population: bees)
- Do cars get better gas mileage with a new gasoline additive? (Population: cars)
The population is the entire group that we want to know something about:
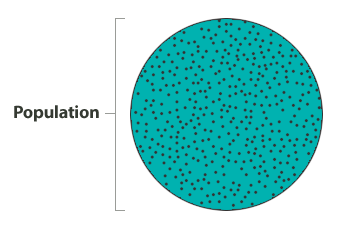
In most cases, the population is a large group. Often, the population is so large that we cannot collect information from every individual in the population. So we select a sample from the population. Then we collect data from this sample. This is the first step in the statistical investigation. We call this step producing data.
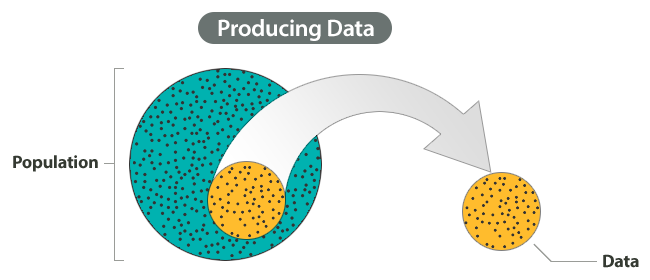
Of course, we need a sample that represents the population well. This involves careful planning but also involves chance. For example, if our goal is to determine the percentage of U.S. adults who favor the death penalty, we do not want our sample to contain only Democrats or only Republicans. So we can give everyone the same opportunity to be in the sample, but we will let chance select the sample.
At this step of the investigation we also carefully define what kind of information we plan to gather. Then we collect the data.
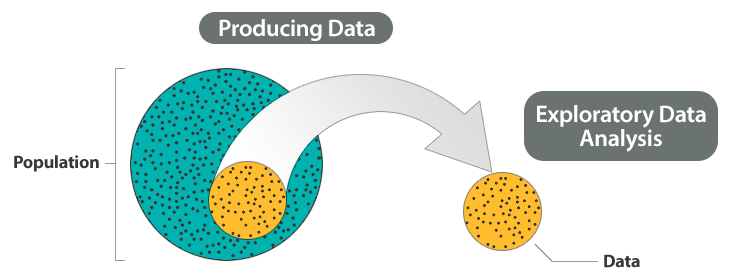
Data is often a long list of information. To make sense of the data, we explore it and summarize it using graphs and different numerical measures, such as percentages or averages. We call this step exploratory data analysis.
Remember, our goal is to answer a question about a population based on a sample. Of course, samples will vary due to chance, and we will need to answer our question in spite of this variability. So we need to understand how sample results will vary and how sample results relate to the population as a whole when chance is involved. This is where probability comes in.
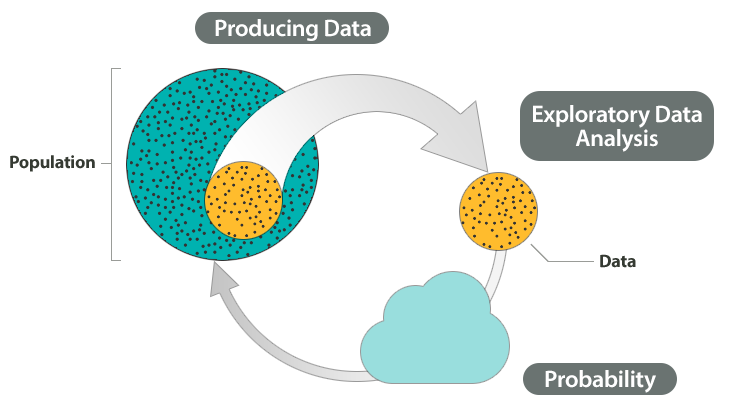
Probability is the “machinery” behind the last step in the process called inference. We infer something about a population based on a sample. This inference is the conclusion we reach from our sample data that answers our original question about the population.
Example – The big picture of statistics
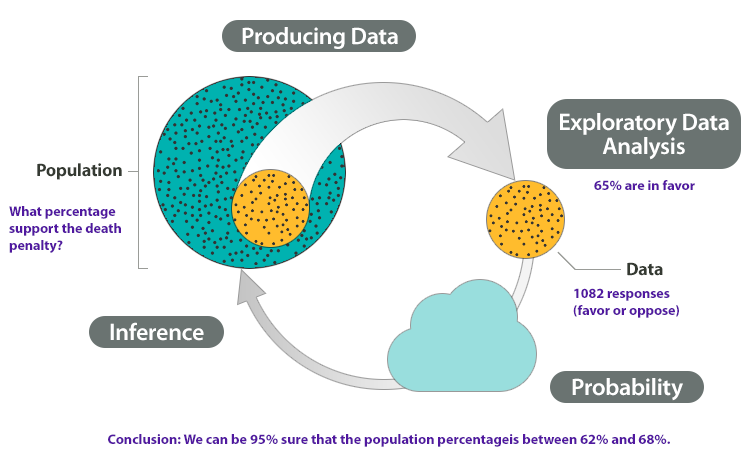
At the end of April 2005, ABC News and the Washington Post conducted a poll to determine the percentage of U.S. adults who support the death penalty.
Research question: What percentage of U.S. adults support the death penalty?
Steps in the statistical investigation:
- Produce Data: Determine what to measure, then collect the data.
The poll selected 1,082 U.S. adults at random. Each adult answered this question: “Do you favor or oppose the death penalty for a person convicted of murder?” - Explore the Data: Analyze and summarize the data.
In the sample, 65% favored the death penalty. - Draw a Conclusion: Use the data, probability, and statistical inference to draw a conclusion about the population.
Our goal is to determine the percentage of the U.S. adult population that supports the death penalty. We know that different samples will give different results. What are the chances that our sample reflects the opinions of the population within 3%? Probability describes the likelihood that our sample is this accurate. So we can say with 95% confidence that between 62% and 68% of the population favor the death penalty.
Let’s Summarize
A statistical investigation with a research question. Then the investigation proceeds with the following steps:
- Produce Data: Determine what to measure, then collect the data.
- Explore the Data: Analyze and summarize the data (also called exploratory data analysis).
- Draw a Conclusion: Use the data, probability, and statistical inference to draw a conclusion about the population.
Types of Statistical Studies and Producing Data
In this first module, we focus on the produce data step in a statistical investigation. We discuss two types of statistical investigations: the observational study and the experiment. Each type of investigation involves a different approach to collecting data. We will also see that our approach to collecting data determines what we can conclude from the data.
Candela Citations
- Concepts in Statistics. Provided by: Open Learning Initiative. Located at: http://oli.cmu.edu. License: CC BY: Attribution