Figure 1. Our eyes take in sensory information that helps us understand the world around us. (credit “top left”: modification of work by “rajkumar1220″/Flickr”; credit “top right”: modification of work by Thomas Leuthard; credit “middle left”: modification of work by Demietrich Baker; credit “middle right”: modification of work by “kaybee07″/Flickr; credit “bottom left”: modification of work by “Isengardt”/Flickr; credit “bottom right”: modification of work by Willem Heerbaart)
The visual system constructs a mental representation of the world around us. This contributes to our ability to successfully navigate through physical space and interact with important individuals and objects in our environments. This section will provide an overview of the basic anatomy and function of the visual system. In addition, you’ll explore our ability to perceive color and depth.
Anatomy of the Visual System
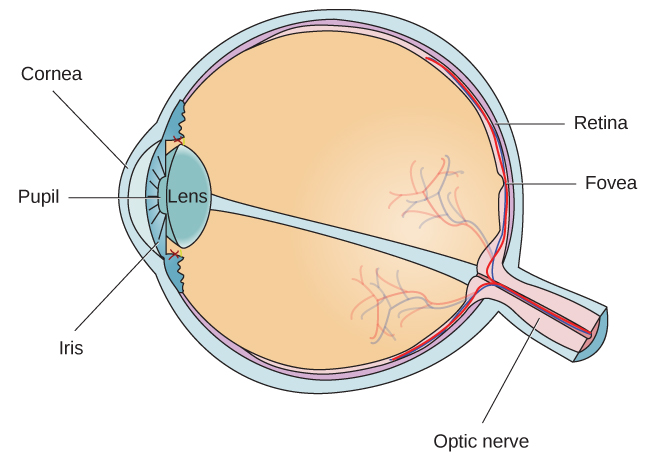
Figure 2. The anatomy of the eye is illustrated in this diagram.
After passing through the pupil, light crosses the lens, a curved, transparent structure that serves to provide additional focus. The lens is attached to muscles that can change its shape to aid in focusing light that is reflected from near or far objects. In a normal-sighted individual, the lens will focus images perfectly on a small indentation in the back of the eye known as the fovea, which is part of the retina, the light-sensitive lining of the eye. The fovea contains densely packed specialized photoreceptor cells. These photoreceptor cells, known as cones, are light-detecting cells. The cones are specialized types of photoreceptors that work best in bright light conditions. Cones are very sensitive to acute detail and provide tremendous spatial resolution. They also are directly involved in our ability to perceive color.
While cones are concentrated in the fovea, where images tend to be focused, rods, another type of photoreceptor, are located throughout the remainder of the retina. Rods are specialized photoreceptors that work well in low light conditions, and while they lack the spatial resolution and color function of the cones, they are involved in our vision in dimly lit environments as well as in our perception of movement on the periphery of our visual field.

Figure 3. The two types of photoreceptors are shown in this image. Rods are colored green and cones are blue.
We have all experienced the different sensitivities of rods and cones when making the transition from a brightly lit environment to a dimly lit environment. Imagine going to see a blockbuster movie on a clear summer day. As you walk from the brightly lit lobby into the dark theater, you notice that you immediately have difficulty seeing much of anything. After a few minutes, you begin to adjust to the darkness and can see the interior of the theater. In the bright environment, your vision was dominated primarily by cone activity. As you move to the dark environment, rod activity dominates, but there is a delay in transitioning between the phases. If your rods do not transform light into nerve impulses as easily and efficiently as they should, you will have difficulty seeing in dim light, a condition known as night blindness.
Rods and cones are connected (via several interneurons) to retinal ganglion cells. Axons from the retinal ganglion cells converge and exit through the back of the eye to form the optic nerve. The optic nerve carries visual information from the retina to the brain. There is a point in the visual field called the blind spot: Even when light from a small object is focused on the blind spot, we do not see it. We are not consciously aware of our blind spots for two reasons: First, each eye gets a slightly different view of the visual field; therefore, the blind spots do not overlap. Second, our visual system fills in the blind spot so that although we cannot respond to visual information that occurs in that portion of the visual field, we are also not aware that information is missing.
Try It
The optic nerve from each eye merges just below the brain at a point called the optic chiasm. As Figure 3 shows, the optic chiasm is an X-shaped structure that sits just below the cerebral cortex at the front of the brain. At the point of the optic chiasm, information from the right visual field (which comes from both eyes) is sent to the left side of the brain, and information from the left visual field is sent to the right side of the brain.
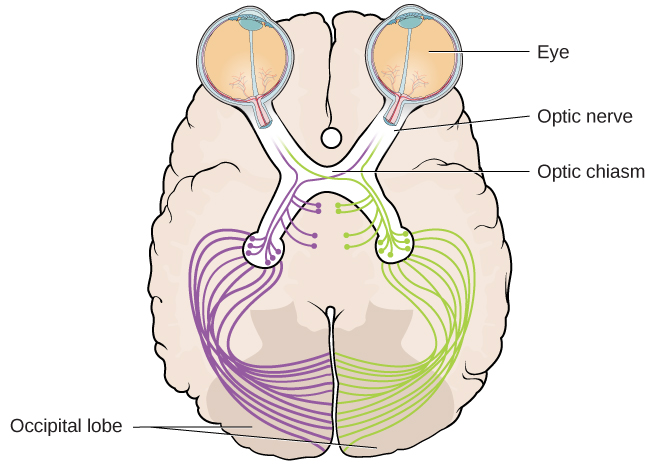
Figure 3. This illustration shows the optic chiasm at the front of the brain and the pathways to the occipital lobe at the back of the brain, where visual sensations are processed into meaningful perceptions.
Once inside the brain, visual information is sent via a number of structures to the occipital lobe at the back of the brain for processing. Visual information might be processed in parallel pathways which can generally be described as the “what pathway” (the ventral pathway) and the “where/how” pathway (the dorsal pathway). The “what pathway” is involved in object recognition and identification, while the “where/how pathway” is involved with location in space and how one might interact with a particular visual stimulus (Milner & Goodale, 2008; Ungerleider & Haxby, 1994). For example, when you see a ball rolling down the street, the “what pathway” identifies what the object is, and the “where/how pathway” identifies its location or movement in space.

Figure 4. Visual areas in the brain.
Try It
Amplitude and Wavelength
As mentioned above, light enters your eyes as a wave. It is important to understand some basic properties of waves to see how they impact what we see. Two physical characteristics of a wave are amplitude and wavelength (Figure 5). The amplitude of a wave is the height of a wave as measured from the highest point on the wave (peak or crest) to the lowest point on the wave (trough). Wavelength refers to the length of a wave from one peak to the next.
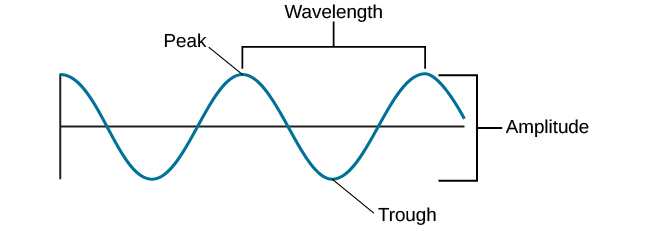
Figure 5. The amplitude or height of a wave is measured from the peak to the trough. The wavelength is measured from peak to peak.
Wavelength is directly related to the frequency of a given wave form. Frequency refers to the number of waves that pass a given point in a given time period and is often expressed in terms of hertz (Hz), or cycles per second. Longer wavelengths will have lower frequencies, and shorter wavelengths will have higher frequencies (Figure 6).
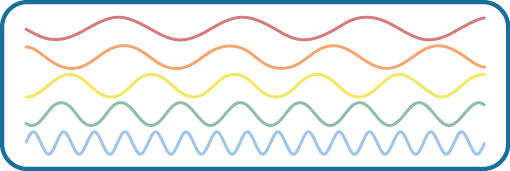
Figure 6. This figure illustrates waves of differing wavelengths/frequencies. At the top of the figure, the red wave has a long wavelength/short frequency. Moving from top to bottom, the wavelengths decrease and frequencies increase.
Light Waves
The visible spectrum is the portion of the larger electromagnetic spectrum that we can see. As Figure 7 shows, the electromagnetic spectrum encompasses all of the electromagnetic radiation that occurs in our environment and includes gamma rays, x-rays, ultraviolet light, visible light, infrared light, microwaves, and radio waves. The visible spectrum in humans is associated with wavelengths that range from 380 to 740 nm—a very small distance, since a nanometer (nm) is one-billionth of a meter. Other species can detect other portions of the electromagnetic spectrum. For instance, honeybees can see light in the ultraviolet range (Wakakuwa, Stavenga, & Arikawa, 2007), and some snakes can detect infrared radiation in addition to more traditional visual light cues (Chen, Deng, Brauth, Ding, & Tang, 2012; Hartline, Kass, & Loop, 1978).
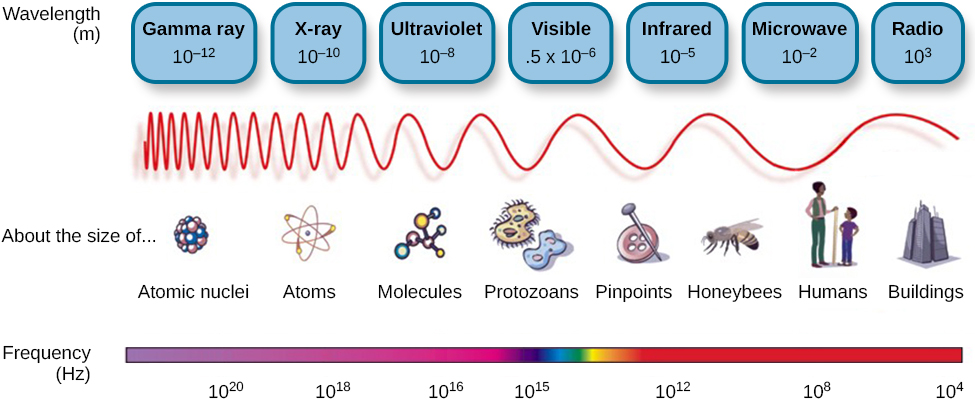
Figure 7. Light that is visible to humans makes up only a small portion of the electromagnetic spectrum.
In humans, light wavelength is associated with the perception of color (Figure 8). Within the visible spectrum, our experience of red is associated with longer wavelengths, greens are intermediate, and blues and violets are shorter in wavelength. (An easy way to remember this is the mnemonic ROYGBIV: red, orange, yellow, green, blue, indigo, violet.) The amplitude of light waves is associated with our experience of brightness or intensity of color, with larger amplitudes appearing brighter.
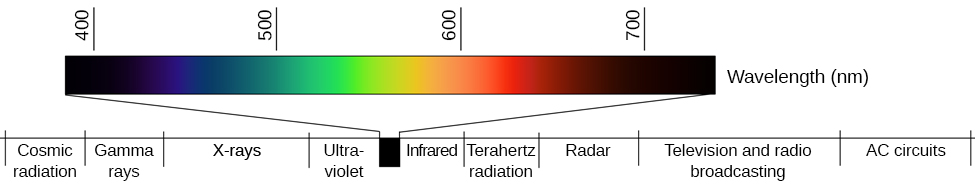
Figure 8. Different wavelengths of light are associated with our perception of different colors. (credit: modification of work by Johannes Ahlmann)
Try It
We do not see the world in black and white; neither do we see it as two-dimensional (2-D) or flat (just height and width, no depth). Let’s look at how color vision works and how we perceive three dimensions (height, width, and depth).
Color Vision
Normal-sighted individuals have three different types of cones that mediate color vision. Each of these cone types is maximally sensitive to a slightly different wavelength of light. According to the Young-Helmholtz trichromatic theory of color vision, shown in Figure 9, all colors in the spectrum can be produced by combining red, green, and blue. The three types of cones are each receptive to one of the colors.

Figure 9. This figure illustrates the different sensitivities for the three cone types found in a normal-sighted individual. (credit: modification of work by Vanessa Ezekowitz)
The trichromatic theory of color vision is not the only theory—another major theory of color vision is known as the opponent-process theory. According to this theory, color is coded in opponent pairs: black-white, yellow-blue, and green-red. The basic idea is that some cells of the visual system are excited by one of the opponent colors and inhibited by the other. So, a cell that was excited by wavelengths associated with green would be inhibited by wavelengths associated with red, and vice versa. One of the implications of opponent processing is that we do not experience greenish-reds or yellowish-blues as colors. Another implication is that this leads to the experience of negative afterimages. An afterimage describes the continuation of a visual sensation after removal of the stimulus. For example, when you stare briefly at the sun and then look away from it, you may still perceive a spot of light although the stimulus (the sun) has been removed. When color is involved in the stimulus, the color pairings identified in the opponent-process theory lead to a negative afterimage. You can test this concept using the flag in Figure 10.

Figure 10. Stare at the white dot for 30–60 seconds and then move your eyes to a blank piece of white paper. What do you see? This is known as a negative afterimage, and it provides empirical support for the opponent-process theory of color vision.
Video 1. Color Vision: Trichromatic and Opponent Process Theory.
But these two theories—the trichromatic theory of color vision and the opponent-process theory—are not mutually exclusive. Research has shown that they just apply to different levels of the nervous system. For visual processing on the retina, the trichromatic theory applies: the cones are responsive to three different wavelengths that represent red, blue, and green. But once the signal moves past the retina on its way to the brain, the cells respond in a way consistent with opponent-process theory (Land, 1959; Kaiser, 1997).
Try It
Depth Perception
Our ability to perceive spatial relationships in three-dimensional (3-D) space is known as depth perception. With depth perception, we can describe things as being in front, behind, above, below, or to the side of other things.
Our world is three-dimensional, so it makes sense that our mental representation of the world has three-dimensional properties. We use a variety of cues in a visual scene to establish our sense of depth. Some of these are binocular cues, which means that they rely on the use of both eyes. One example of a binocular depth cue is binocular disparity, the slightly different view of the world that each of our eyes receives. To experience this slightly different view, do this simple exercise: extend your arm fully and extend one of your fingers and focus on that finger. Now, close your left eye without moving your head, then open your left eye and close your right eye without moving your head. You will notice that your finger seems to shift as you alternate between the two eyes because of the slightly different view each eye has of your finger.
A 3-D movie works on the same principle: the special glasses you wear allow the two slightly different images projected onto the screen to be seen separately by your left and your right eye. As your brain processes these images, you have the illusion that the leaping animal or running person is coming right toward you.
Although we rely on binocular cues to experience depth in our 3-D world, we can also perceive depth in 2-D arrays. Think about all the paintings and photographs you have seen. Generally, you pick up on depth in these images even though the visual stimulus is 2-D. When we do this, we are relying on a number of monocular cues, or cues that require only one eye. If you think you can’t see depth with one eye, note that you don’t bump into things when using only one eye while walking—and, in fact, we have more monocular cues than binocular cues.
Video 1. Visual Cues
An example of a monocular cue would be what is known as linear perspective. Linear perspective refers to the fact that we perceive depth when we see two parallel lines that seem to converge in an image (Figure 11). Some other monocular depth cues are interposition, the partial overlap of objects, the relative size and closeness of images to the horizon, relative size, and the variation between light and shadow.

Figure 11. We perceive depth in a two-dimensional figure like this one through the use of monocular cues like linear perspective, like the parallel lines converging as the road narrows in the distance. (credit: Marc Dalmulder)
Dig Deeper: Stereoblindness
Bruce Bridgeman was born with an extreme case of lazy eye that resulted in him being stereoblind, or unable to respond to binocular cues of depth. He relied heavily on monocular depth cues, but he never had a true appreciation of the 3-D nature of the world around him. This all changed one night in 2012 while Bruce was seeing a movie with his wife.
The movie the couple was going to see was shot in 3-D, and even though he thought it was a waste of money, Bruce paid for the 3-D glasses when he purchased his ticket. As soon as the film began, Bruce put on the glasses and experienced something completely new. For the first time in his life, he appreciated the true depth of the world around him. Remarkably, his ability to perceive depth persisted outside of the movie theater.
There are cells in the nervous system that respond to binocular depth cues. Normally, these cells require activation during early development in order to persist, so experts familiar with Bruce’s case (and others like his) assume that at some point in his development, Bruce must have experienced at least a fleeting moment of binocular vision. It was enough to ensure the survival of the cells in the visual system tuned to binocular cues. The mystery now is why it took Bruce nearly 70 years to have these cells activated (Peck, 2012).
Try It
Photos in this activity from of GlacierNPS, Alicia Nijdam, KlipschFan, scillystuff, rhondawebber (CC-BY-2.0)
Integration with Other Modalities
Vision is not an encapsulated system. It interacts with and depends on other sensory modalities. For example, when you move your head in one direction, your eyes reflexively move in the opposite direction to compensate, allowing you to maintain your gaze on the object that you are looking at. This reflex is called the vestibulo-ocular reflex. It is achieved by integrating information from both the visual and the vestibular system (which knows about body motion and position). You can experience this compensation quite simply. First, while you keep your head still and your gaze looking straight ahead, wave your finger in front of you from side to side. Notice how the image of the finger appears blurry. Now, keep your finger steady and look at it while you move your head from side to side. Notice how your eyes reflexively move to compensate the movement of your head and how the image of the finger stays sharp and stable. Vision also interacts with your proprioceptive system, to help you find where all your body parts are, and with your auditory system, to help you understand the sounds people make when they speak. You can learn more about this in the multimodal module.
Finally, vision is also often implicated in a blending-of-sensations phenomenon known as synesthesia. Synesthesia occurs when one sensory signal gives rise to two or more sensations. The most common type is grapheme-color synesthesia. About 1 in 200 individuals experience a sensation of color associated with specific letters, numbers, or words: the number 1 might always be seen as red, the number 2 as orange, etc. But the more fascinating forms of synesthesia blend sensations from entirely different sensory modalities, like taste and color or music and color: the taste of chicken might elicit a sensation of green, for example, and the timbre of violin a deep purple.
Video 2. Exploring Synesthesia.
Glossary
Candela Citations
- Vision. Authored by: OpenStax College. Located at: http://cnx.org/contents/Sr8Ev5Og@5.52:E-7sLQFP@5/Vision. License: CC BY: Attribution. License Terms: Download for free at http://cnx.org/contents/4abf04bf-93a0-45c3-9cbc-2cefd46e68cc@5.48
- Modification, adaptation, and original content. Provided by: Lumen Learning. License: CC BY: Attribution
- Waves and Wavelenghts. Authored by: OpenStax College. Located at: http://cnx.org/contents/Sr8Ev5Og@5.52:1Cicp6CO@8/Waves-and-Wavelengths. License: CC BY: Attribution. License Terms: Download for free at http://cnx.org/contents/4abf04bf-93a0-45c3-9cbc-2cefd46e68cc@5.48
- Vision, information and visual and ventral and dorsal pathways, Integration with Other Modalities. Authored by: Simona Buetti and Alejandro Lleras . Provided by: University of Illinois at Urbana-Champaign. Located at: http://nobaproject.com/modules/vision. Project: The Noba Project. License: CC BY-NC-SA: Attribution-NonCommercial-ShareAlike
- Waves and Wavelengths. Authored by: OpenStax College. Located at: http://cnx.org/contents/Sr8Ev5Og@5.52:1Cicp6CO@8/Waves-and-Wavelengths. License: CC BY: Attribution. License Terms: Download for free at http://cnx.org/contents/4abf04bf-93a0-45c3-9cbc-2cefd46e68cc@5.48
- Amazing Anamorphic Illusions. Authored by: brusspup. Located at: https://www.youtube.com/watch?v=tBNHPk-Lnkk. License: Other. License Terms: Standard YouTube License