In contrast to descriptive research, which is designed primarily to provide static pictures, correlational research involves the measurement of two or more relevant variables and an assessment of the relationship between or among those variables. For instance, the variables of height and weight are systematically related (correlated) because taller people generally weigh more than shorter people.
The Pearson Correlation Coefficient, symbolized by the letter r, is the most common statistical measure of the strength of linear relationships among variables. The value of the correlation coefficient ranges from r= –1.00 to r = +1.00. The strength of the linear relationship is indexed by the distance of the correlation coefficient from zero (its absolute value). For instance, r = –.54 is a stronger relationship than r= .30, and r = .72 is a stronger relationship than r = –.57. The direction of the linear relationship is indicated by the sign of the correlation coefficient. Positive values of r (such as r = .54 or r = .67) indicate that the relationship is positive (i.e., the pattern of the dots on the scatter plot runs from the lower left to the upper right), whereas negative values of r (such as r = –.30 or r = –.72) indicate negative relationships (i.e., the dots run from the upper left to the lower right).
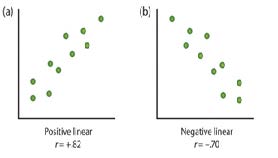
Figure 1.14 Some examples of relationships between two variables as shown in scatter plots.
When the straight line indicates that individuals who have high values for one variable also tend to have high values for the other variable, as in part (a), the relationship is said to be positive correlation. Examples of positive correlations include those between education and income, and between age and mathematical abilities in children. In each case people who score higher on one of the variables also tend to score higher on the other variable. Negative correlations, in contrast, as shown in part (b), occur when high values for one variable tend to be associated with low values for the other variable. Examples of negative correlations include those between the age of a child and the number of diapers the child uses, and between practice and errors made on a learning task. In these cases people who score higher on one of the variables tend to score lower on the other variable.
An important limitation of correlational research designs is that they cannot be used to draw conclusions about the causal relationships among the measured variables. Consider, for instance, a researcher who has hypothesized that viewing violent behavior will cause increased aggressive play in children. He has collected, from a sample of fourth-grade children, a measure of how much violent television each child views during the week, as well as a measure of how aggressively each child plays. The researcher discovers a positive correlation between the two measured variables. Although this positive correlation appears to support the hypothesis, it cannot be taken to indicate that viewing violent television causes aggressive behavior as there are other possible explanations. One alternative is that children who behaved aggressively at school want to watch violent television shows. Still another possible explanation for the observed correlation is that it has been produced by the presence of a third variable.
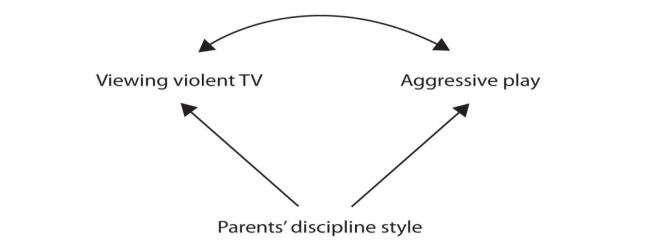
Figure 1.15
A third variable is a variable that is not part of the research hypothesis but produces the observed correlation between them. In our example a potential third variable is the discipline style of the children’s parents.
Parents who use a harsh and punitive discipline style may produce children who both like to watch violent television and who behave aggressively in comparison to children whose parents use less harsh discipline.
For this reason, we are left with the basic limitation of correlational research: Correlation does not demonstrate causation! It is important that when you read about correlational research projects, you keep in mind the possibility of third variables.
Strengths and limitations: Correlational research can be used when experimental research is not possible because the variables cannot be manipulated or it would be unethical to use an experiment. Correlational designs also have the advantage of allowing the researcher to study behavior as it occurs in everyday life. We can also use correlational designs to make predictions. For instance, we can predict from the scores on a battery of tests the success of job trainees during a training session. However, we cannot use such correlational information to determine whether one variable caused another variable. For that, researchers rely on an experiment.
Candela Citations
- Authored by: Martha Lally and Suzanne Valentine-French. Provided by: College of Lake County Foundation. Located at: http://dept.clcillinois.edu/psy/LifespanDevelopment.pdf. License: CC BY-NC-SA: Attribution-NonCommercial-ShareAlike