Phases of the Business Cycle
In this section, our goal is to use the concept of real GDP to look at the business cycle—the economy’s pattern of expansion, then contraction, then expansion again—and at growth of real GDP.
Figure 5.1 “Phases of the Business Cycle” shows a stylized picture of a typical business cycle. It shows that economies go through periods of increasing and decreasing real GDP, but that over time they generally move in the direction of increasing levels of real GDP. A sustained period in which real GDP is rising is an expansion; a sustained period in which real GDP is falling is a recession. Typically, an economy is said to be in a recession when real GDP drops for two consecutive quarters, but in the United States, the responsibility of defining precisely when the economy is in recession is left to the Business Cycle Dating Committee of the National Bureau of Economic Research (NBER). The Committee defines a recession as a “significant decline in economic activity spread across the economy, lasting more than a few months, normally visible in real GDP, real income, employment, industrial production, and wholesale-retail sales.”
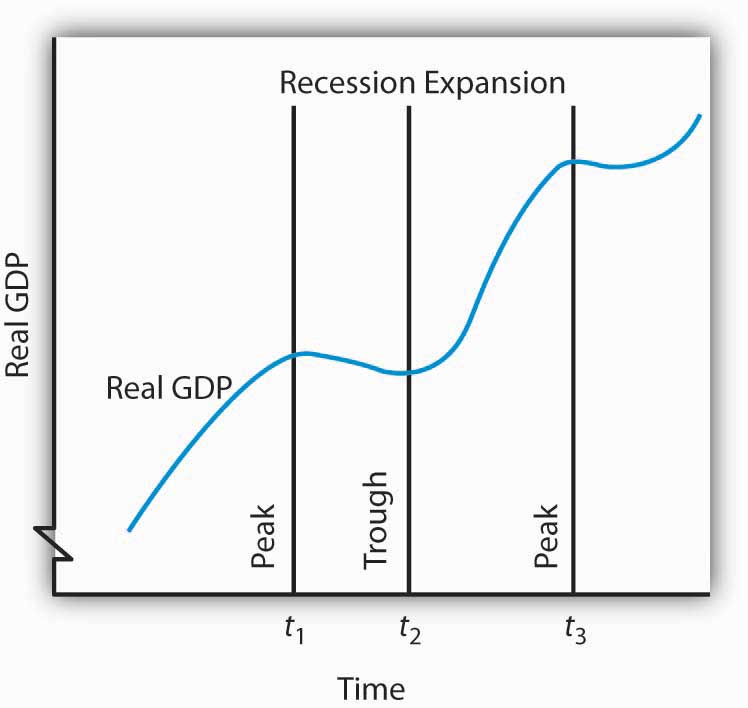
Figure 5.1. Phases of the Business Cycle. The business cycle is a series of expansions and contractions in real GDP. The cycle begins at a peak and continues through a recession, a trough, and an expansion. A new cycle begins at the next peak. Here, the first peak occurs at time t1, the trough at time t2, and the next peak at time t3. Notice that there is a tendency for real GDP to rise over time.
At time t1 in Figure 5.1 “Phases of the Business Cycle”, an expansion ends and real GDP turns downward. The point at which an expansion ends and a recession begins is called the peak of the business cycle. Real GDP then falls during a period of recession. Eventually it starts upward again (at time t2). The point at which a recession ends and an expansion begins is called the trough of the business cycle. The expansion continues until another peak is reached at time t3.Some economists prefer to break the expansion phase into two parts. The recovery phase is said to be the period between the previous trough and the time when the economy achieves its previous peak level of real GDP. The “expansion” phase is from that point until the following peak. A complete business cycle is defined by the passage from one peak to the next.
Because the Business Cycle Dating Committee dates peaks and troughs by specific months, and because real GDP is estimated only on a quarterly basis by the Bureau of Economic Analysis, the committee relies on a variety of other indicators that are published monthly, including real personal income, employment, industrial production, and real wholesale and retail sales. The committee typically determines that a recession has happened long after it has actually begun and sometimes ended! In large part, that avoids problems when data released about the economy are revised, and the committee avoids having to reverse itself on its determination of when a recession begins or ends, something it has never done. In December 2008, the Committee announced that a recession in the United States had begun in December 2007. Interestingly, real GDP fell in the fourth quarter of 2007, grew in the first and second quarters of 2008, and shrank in the third quarter of 2008, so clearly the Committee was not using the two consecutive quarters of declining GDP rule-of-thumb. Rather, it was taking into account the behavior of a variety of other variables, such as employment and personal income.
Business Cycles and the Growth of Real GDP in the United States
Figure 5.2 “Expansions and Recessions, 1960–2008” shows movements in real GDP in the United States from 1960 to 2008. Over those years, the economy experienced eight recessions, shown by the shaded areas in the chart. Although periods of expansion have been more prolonged than periods of recession, we see the cycle of economic activity that characterizes economic life.
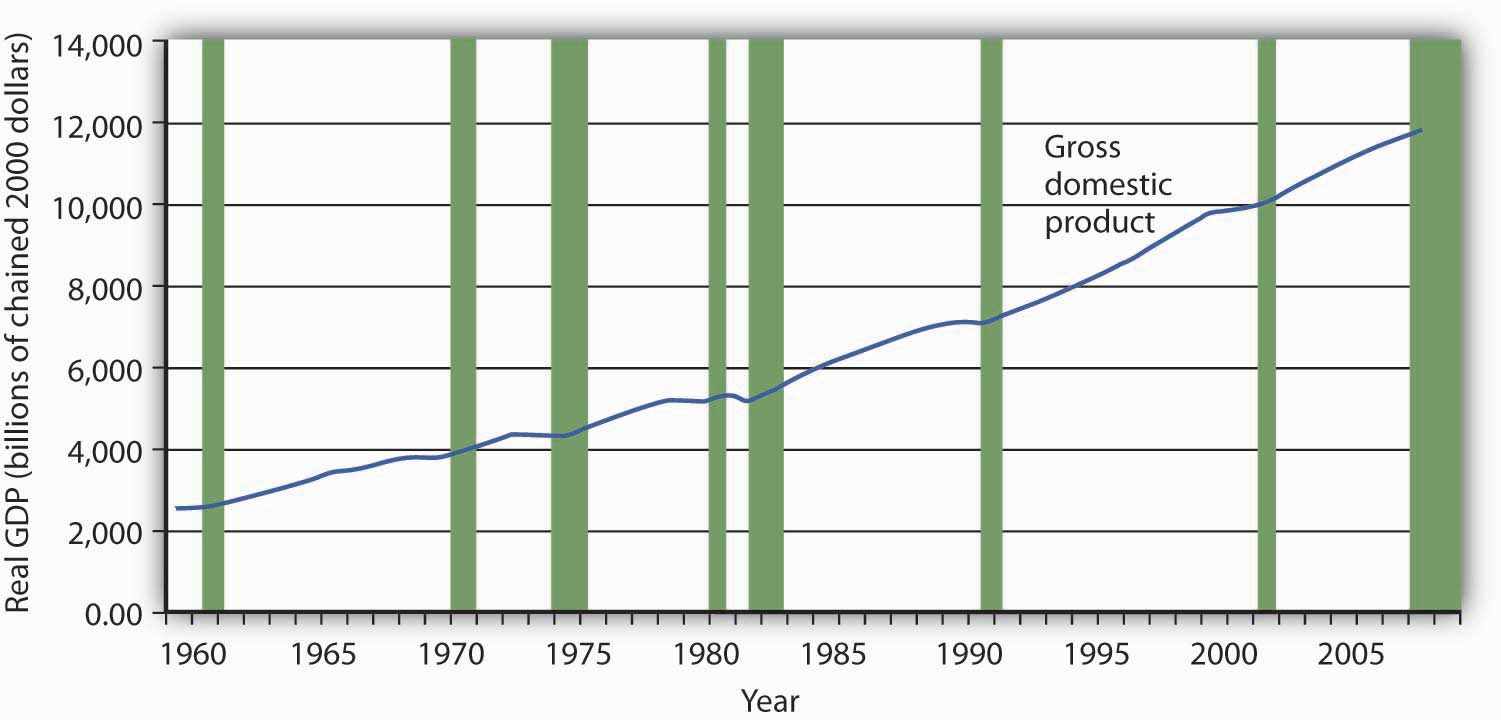
Figure 5.2. Expansions and Recessions, 1960–2008. The chart shows movements in real GDP since 1960. Recessions—periods of falling real GDP—are shown as shaded areas. On average, the annual rate of growth of real GDP over the period was 3.3% per year. Source: Bureau of Economic Analysis, NIPA Table 1.1.6. Real Gross Domestic Product, Chained Dollars [Billions of chained (2000) dollars]. Seasonally adjusted at annual rates. Data for 2008 is through 3rd quarter.
Real GDP clearly grew between 1960 and 2008. While the economy experienced expansions and recessions, its general trend during the period was one of rising real GDP. The average annual rate of growth of real GDP was about 3.3%.
During the post–World War II period, the average expansion has lasted 57 months, and the average recession has lasted about 10 months. The 2001 recession, which lasted eight months, was thus slightly shorter than the average. The Great Recession (2007-2009), lasted longer than the average recession at nineteen months.
Economists have sought for centuries to explain the forces at work in a business cycle. Not only are the currents that move the economy up or down intellectually fascinating but also an understanding of them is of tremendous practical importance. A business cycle is not just a movement along a curve in a textbook. It is new jobs for people, or the loss of them. It is new income, or the loss of it. It is the funds to build new schools or to provide better health care—or the lack of funds to do all those things. The story of the business cycle is the story of progress and plenty, of failure and sacrifice.
The effects of recessions extend beyond the purely economic realm and influence the social fabric of society as well. Suicide rates and property crimes—burglary, larceny, and motor vehicle theft tend to rise during recessions. Even popular music appears to be affected. Terry F. Pettijohn II, a psychologist at Coastal Carolina University, has studied Billboard No. 1 songs from 1955–2003. He finds that during recessions, popular songs tend to be longer and slower, and to have more serious lyrics. “It’s ‘Bridge over Troubled Water’ or ‘That’s What Friends Are For’,” he says. During expansions, songs tend to be faster, shorter, and somewhat sillier, such as “At the Hop” or “My Sharona.”
In our study of macroeconomics, we will gain an understanding of the forces at work in the business cycle. We will also explore policies through which the public sector might act to make recessions less severe and, perhaps, to prolong expansions. We turn next to an examination of price-level changes and unemployment.
Candela Citations
- Principles of Macroeconomics Chapter 5.1. Authored by: Anonymous. Located at: http://2012books.lardbucket.org/books/macroeconomics-principles-v1.0/s08-01-growth-of-real-gdp-and-busines.html. License: CC BY-NC-SA: Attribution-NonCommercial-ShareAlike