Earth’s Temperature is a Balancing Act
Earth’s temperature depends on the balance between energy entering and leaving the planet. When incoming energy from the sun is absorbed, Earth warms. When the sun’s energy is reflected back into space, Earth avoids warming. When energy is released back into space, Earth cools. Many factors, both natural and human, can cause changes in Earth’s energy balance, including:
- Changes in the greenhouse effect, which affects the amount of heat retained by Earth’s atmosphere
- Variations in the sun’s energy reaching Earth
- Changes in the reflectivity of Earth’s atmosphere and surface
Scientists have pieced together a picture of Earth’s climate, dating back hundreds of thousands of years, by analyzing a number of indirect measures of climate such as ice cores, tree rings, glacier size, pollen counts, and ocean sediments. Scientists have also studied changes in Earth’s orbit around the sun and the activity of the sun itself.
The historical record shows that the climate varies naturally over a wide range of time scales. In general, climate changes prior to the Industrial Revolution in the 1700s can be explained by natural causes, such as changes in solar energy, volcanic eruptions, and natural changes in greenhouse gas (GHG) concentrations. Recent changes in climate, however, cannot be explained by natural causes alone. Research indicates that natural causes are very unlikely to explain most observed warming, especially warming since the mid-20th century. Rather, human activities can very likely explain most of that warming.
The greenhouse effect causes the atmosphere to retain heat
When sunlight reaches Earth’s surface, it can either be reflected back into space or absorbed by Earth. Once absorbed, the planet releases some of the energy back into the atmosphere as heat (in the form of infrared radiation). Greenhouse gases (GHGs) like water vapor (H2O), carbon dioxide (CO2), and methane (CH4) absorb infrared radiation, slowing or preventing the loss of heat to space. In this way, GHGs act like a blanket, making Earth warmer than it would otherwise be. This process is commonly known as the “greenhouse effect” (Figure 1).
| What is Global Warming? |
| Global warming refers to the recent and ongoing rise in global average temperature near Earth’s surface. It is caused mostly by increasing concentrations of greenhouse gases in the atmosphere. Global warming is causing climate patterns to change. However, global warming itself represents only one aspect of climate change. |
| What is Climate Change? |
| Climate change refers to any significant change in the measures of climate lasting for an extended period of time. In other words, climate change includes major changes in temperature, precipitation, or wind patterns, among other effects, that occur over several decades or longer. |
Humans are largely responsible for recent climate change
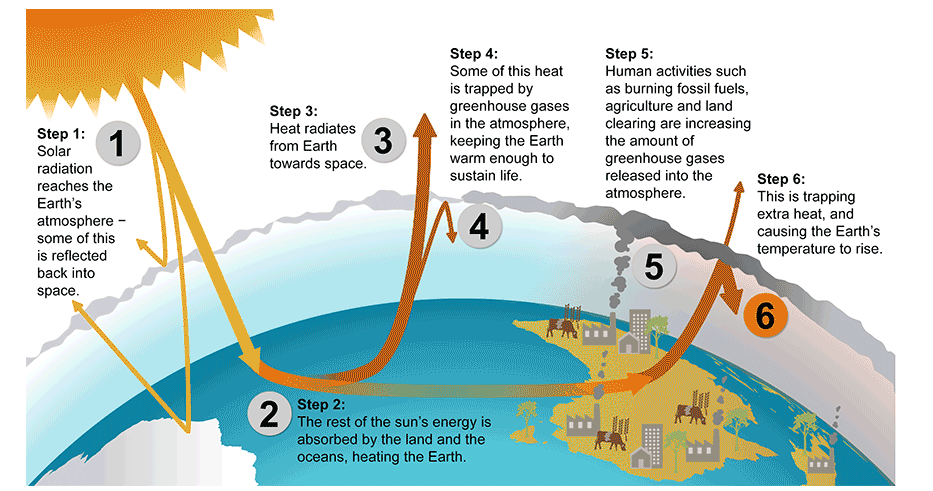
Figure 1. Enhanced Greenhouse Effect
The Main Greenhouse Gasses
The most important GHGs directly emitted by humans include CO2, methane, nitrous oxide (N2O), and several others. The sources and recent trends of these gases are detailed below.
Carbon dioxide (CO2) is the primary greenhouse gas that is contributing to recent climate change. CO2 is absorbed and emitted naturally as part of the carbon cycle, through respiration, volcanic eruptions, and ocean-atmosphere exchange. Human activities, such as the burning of fossil fuels and changes in land use, release large amounts of carbon to the atmosphere, causing CO2 concentrations in the atmosphere to rise.
Atmospheric CO2 concentrations have increased by almost 40% since pre-industrial times, from approximately 280 parts per million (ppm) in the 18th century to 406 ppm in 2017. The current CO2 level is higher than it has been in at least 800,000 years. Some volcanic eruptions released large quantities of CO2 in the distant past. However, the U.S. Geological Survey (USGS) reports that human activities now emit more than 135 times as much CO2 as volcanoes each year. Human activities currently release over 30 billion tons of CO2 into the atmosphere every year. This build-up in the atmosphere is like a tub filling with water, where more water flows from the faucet than the drain can take away.
Methane (CH4) is produced through both natural and human activities. For example, wetlands, agricultural activities, and fossil fuel extraction and transport all emit CH4. Methane is more abundant in Earth’s atmosphere now than at any time in at least the past 650,000 years. Due to human activities, CH4 concentrations increased sharply during most of the 20th century and are now more than two and-a-half times pre-industrial levels. In recent decades, the rate of increase has slowed considerably.
Other Greenhouse Gasses
Water vapor is the most abundant greenhouse gas and also the most important in terms of its contribution to the natural greenhouse effect, despite having a short atmospheric lifetime. Some human activities can influence local water vapor levels. However, on a global scale, the concentration of water vapor is controlled by temperature, which influences overall rates of evaporation and precipitation. Therefore, the global concentration of water vapor is not substantially affected by direct human emissions.
Ground-level ozone (O3), which also has a short atmospheric lifetime, is a potent greenhouse gas. Chemical reactions create ozone from emissions of nitrogen oxides and volatile organic compounds from automobiles, power plants, and other industrial and commercial sources in the presence of sunlight (as discussed in section 10.1). In addition to trapping heat, ozone is a pollutant that can cause respiratory health problems and damage crops and ecosystems.
Changes in the sun’s energy affect how much energy reaches Earth’s system
Climate is influenced by natural changes that affect how much solar energy reaches Earth. These changes include changes within the sun and changes in Earth’s orbit. Changes occurring in the sun itself can affect the intensity of the sunlight that reaches Earth’s surface. The intensity of the sunlight can cause either warming (during periods of stronger solar intensity) or cooling (during periods of weaker solar intensity). The sun follows a natural 11-year cycle of small ups and downs in intensity, but the effect on Earth’s climate is small. Changes in the shape of Earth’s orbit as well as the tilt and position of Earth’s axis can also affect the amount of sunlight reaching Earth’s surface.
Changes in the sun’s intensity have influenced Earth’s climate in the past. For example, the so-called “Little Ice Age” between the 17th and 19th centuries may have been partially caused by a low solar activity phase from 1645 to 1715, which coincided with cooler temperatures. The “Little Ice Age” refers to a slight cooling of North America, Europe, and probably other areas around the globe. Changes in Earth’s orbit have had a big impact on climate over tens of thousands of years. These changes appear to be the primary cause of past cycles of ice ages, in which Earth has experienced long periods of cold temperatures (ice ages), as well as shorter interglacial periods (periods between ice ages) of relatively warmer temperatures.
Changes in solar energy continue to affect climate. However, solar activity has been relatively constant, aside from the 11-year cycle, since the mid-20th century and therefore does not explain the recent warming of Earth. Similarly, changes in the shape of Earth’s orbit as well as the tilt and position of Earth’s axis affect temperature on relatively long timescales (tens of thousands of years), and therefore cannot explain the recent warming.
Changes in reflectivity affect how much energy enters Earth’s system
When sunlight reaches Earth it can be reflected or absorbed. The amount that is reflected or absorbed depends on Earth’s surface and atmosphere. Light-colored objects and surfaces, like snow and clouds, tend to reflect most sunlight, while darker objects and surfaces, like the ocean, forests, or soil, tend to absorb more sunlight. The term albedo refers to the amount of solar radiation reflected from an object or surface, often expressed as a percentage. Earth as a whole has an albedo of about 30%, meaning that 70% of the sunlight that reaches the planet is absorbed. Absorbed sunlight warms Earth’s land, water, and atmosphere.
Albedo is also affected by aerosols. Aerosols are small particles or liquid droplets in the atmosphere that can absorb or reflect sunlight. Unlike greenhouse gases (GHGs), the climate effects of aerosols vary depending on what they are made of and where they are emitted. Those aerosols that reflect sunlight, such as particles from volcanic eruptions or sulfur emissions from burning coal, have a cooling effect. Those that absorb sunlight, such as black carbon (a part of soot), have a warming effect.
Natural changes in albedo, like the melting of sea ice or increases in cloud cover, have contributed to climate change in the past, often acting as feedbacks to other processes. Volcanoes have played a noticeable role in climate. Volcanic particles that reach the upper atmosphere can reflect enough sunlight back to space to cool the surface of the planet by a few tenths of a degree for several years. Volcanic particles from a single eruption do not produce long-term change because they remain in the atmosphere for a much shorter time than GHGs.
Human changes in land use and land cover have changed Earth’s albedo. Processes such as deforestation, reforestation, desertification, and urbanization often contribute to changes in climate in the places they occur. These effects may be significant regionally, but are smaller when averaged over the entire globe.
Climate Change
- Climate change occurs when there are changes in insolation, radation, and composition of the atmosphere.
- Climate is the average of weather, and changes to the earth’s climate occur on long time scales.
Recent climate change, which has occurred during the modern instrument era, is the focus of this module. It is through the lens of long-term climate change (occurring on thousands to millions of years) that we will view earth’s current climate and recent climatechange. The goal is to investigate how the principles listed above are shaping current climate events.
Mechanisms
Temperature Records
Figure Northern Hemisphere Surface Air clearly shows that the current global average temperature reflects an interglacial warm period. If we focus in on the end of this record we can observe some of the fine scale changes in the global temperature records. Figure Northern Hemisphere Surface Air combines proxy data (i.e., information from ice cores and tree rings) with the modern instrument record to create a graph showing the last 1300 years of Northern Hemisphere (hereafter, NH) temperatures. Each line on the top two panels represents a different temperature data set collected in the NH and the bottom panel color codes the percentage of overlap among these data sets.

Figure 2: Northern Hemisphere Surface Air Panel (a) – Northern Hemisphere surface air temperature data from the modern instrument era from various sources. Panel (b) – Northern Hemisphere surface air temperature reconstruction dating back 1300 years from various sources. Panel (c) – Percent of overlap between the various sources of Panel (b). Source: Climate Change 2007: The Physical Science Basis: Contribution of Working Group I to the Fourth Assessment Report of the Intergovernmental Panel on Climate Change, Cambridge University Press
Solar Radiation
The net effect of human existence on Earth is to brighten the surface and increase the global solar radiation absorbed by earth. This change is primarily accomplished through intensive agriculture where forest, marshland, and open prairie are cut down and crops like soybeans, corn, wheat, cotton, and rice are grown in their place. Add this to the current high rates of deforestation in South America and Africa and the evidence is clear that mankind has increased the Earth’s solar radiation absorbed. (see Figure Deforestation in the Amazon (2010)

Alterations to the Natural Greenhouse Effect

Figure 4: Annual Global Temperature Anomalies Global average surface temperature from 1880 to 2007. Source: National ClimateData Center
Are humans altering the natural greenhouse effect? Based upon our assessment so far, this is the final mechanism by which the global climate can be changed. Let’s look into the alteration of the chemistry and composition of the earth’s atmosphere. First are humans increasing the amount of water vapor, the most abundant but also weakest greenhouse gas in the atmosphere? As the air temperature increases, the amount of water vapor the atmosphere can hold also increases. However, a closer investigation of the water cycle is needed to understand what will happen to this increase in water vapor. In this cycle, the amount of evaporation must equal the amount of condensation and thus precipitation on a global scale. This equilibrium must be achieved or else water would end up entirely in its liquid form or in its vapor form. Also due to the speed at which the hydrological cycle operates, a large increase in water vapor would be quickly precipitated out of the atmosphere.
Other greenhouse gases progress through their respective cycles much more slowly than water. There are vast amounts of carbon and carbon dioxide in the earth-atmosphere system. Most carbon is locked up in rocks, where it may remain for millions of years. The carbon dioxide that is mobile, however, is mostly found in other places: the ocean, soils, vegetation, fossil fuels like coal, oil, and natural gas, and also in small concentrations in the atmosphere. These reservoirs of CO2 can exchange mass like oceans and clouds do in the water cycle, but with one extremely important difference–the exchange rate is much slower. That means the system can get out of balance and remain out of balance for a long time, hundreds or thousands of years. There are two primary mechanisms for sequestering carbon dioxide that is released into the atmosphere: it can be captured by the respiration of plants, or dissolved in the ocean.
However, the rate at which plants and oceans can take CO2 out of the atmosphere is fixed. Therefore, if a surplus of CO2 is added to the atmosphere, it will stay there for a long time. This has major implications, given the fact that CO2 is a powerful greenhouse gas. The question then to ask becomes, “is this exchange rate out of balance?”
The current average concentration of CO2 in the atmosphere is about 390 parts per million (PPM), which means there are 390 parts of CO2 per million parts of air. That does not seem like very much, but if that small amount of carbon dioxide were removed from the air, the global average temperature would plummet. Has this concentration been changing? To answer the question, we will turn to the findings of Richard Keeling, whose life’s work was the observation of CO2 concentrations at the Mauna Loa Observatory in Hawaii. Beginning in the early 1950s, observations of CO2, a well-mixed gas in our atmosphere, have shown a remarkable climb in concentration. (see Figure CO2 Concentrations at the Mauna Loa Observatory) The “Keeling Curve,” as it is sometimes called, clearly shows that since the 1950s CO2 concentrations have increased steadily from 315 ppm to 390 ppm. The zigzag nature of this graph is due to life cycle of plants in the NH. The NH has much more land area that the SH, so when spring and summer arrive in the NH, the abundance of new plant life reduces the CO2 concentrations in the atmosphere. When the plants die or become dormant in the fall and winter, CO2 concentrations spike again.

What is troublesome about this figure is that the carbon cycle is out of its normal rhythm and a surplus of CO2, a known greenhouse gas, is building in the earth’s atmosphere. Where is this surplus coming from? To answer this question, let’s look at two historical records of CO2 concentrations taken from ice core deposits. The top panel in Figure Changes in Greenhouse Gases from Ice Core and Modern Data shows the past 10,000 years of atmospheric CO2 concentrations. Before 1750, the amount of CO2 in the atmosphere was relatively steady at 280 ppm. Since 1750 there has been a dramatic increase in CO2 concentrations.

If we look even further back in time, over the last half million years, we see a similar story. (see Figure Evidence of ClimateChange) The current concentration of CO2 in the earth’s atmosphere is higher than at any time in the past half million years. Where is this abundance of CO2 coming from? Which reservoirs are being depleted of their CO2 while the atmosphere takes on more? The answer lies in the burning of fossil fuels and in the deforestation of significant chunks of the earth’s forest biomes. Notice the spike in CO2 concentrations beginning around 1750. This time period marks the beginning of the industrial revolution, when fossil fuels overtook wood as the primary energy source on our planet. Over the subsequent two and a half centuries, oil, coal, and natural gas have been extracted from their underground reservoirs and burned to generate electricity and power modern forms of transportation. The exhaust from this process is currently adding 30 billions of tons, or gigatons (Gt), of carbon dioxide to the atmosphere each year. Combine this addition of CO2, a known greenhouse gas, to the subtraction of one of the sinks of CO2through deforestation and the imbalance grows even further.

What is the end result? By examining the earth’s climate, both current and past and by investigating the three ways in which climatecan change, we have arrived at the conclusion that the current warming is being caused by an imbalance in the carbon cycle that has been induced by human activity, namely the burning of fossil fuels. The record warmth over the last 1,300 years is very likely to have been caused by human decisions that have lead to a change in the chemistry of the atmosphere, and which has altered the natural climate variability toward warmer global temperatures. We are essentially changing the climate faster and in a different direction than natural processes have intended.
Is there a scientific consensus on climate change?
Future Climate Change
Greenhouse gas concentrations in the atmosphere will continue to increase unless the billions of tons of anthropogenic emissions each year decrease substantially. Increased concentrations are expected to:
- Increase Earth’s average temperature
- Influence the patterns and amounts of precipitation
- Reduce ice and snow cover, as well as permafrost
- Raise sea level
- Increase the acidity of the oceans
These changes will impact our food supply, water resources, infrastructure, ecosystems, and even our own health. The magnitude and rate of future climate change will primarily depend on the following factors:
- The rate at which levels of greenhouse gas concentrations in our atmosphere continue to increase
- How strongly features of the climate (e.g., temperature, precipitation, and sea level) respond to the expected increase in greenhouse gas concentrations
- Natural influences on climate (e.g., from volcanic activity and changes in the sun’s intensity) and natural processes within the climate system (e.g., changes in ocean circulation patterns)
Past and present-day greenhouse gas emissions will affect climate far into the future
Many greenhouse gases stay in the atmosphere for long periods of time. As a result, even if emissions stopped increasing, atmospheric greenhouse gas concentrations would continue to increase and remain elevated for hundreds of years. Moreover, if we stabilized concentrations and the composition of today’s atmosphere remained steady (which would require a dramatic reduction in current greenhouse gas emissions), surface air temperatures would continue to warm. This is because the oceans, which store heat, take many decades to fully respond to higher greenhouse gas concentrations. The ocean’s response to higher greenhouse gas concentrations and higher temperatures will continue to impact climate over the next several decades to hundreds of years.
Observed Effects of Climate Change
Cherry Blossoms
In Japan each spring millions of people celebrate the blossoming of the cherry trees to mark the arrival of warmer weather. These celebrations have a long and storied history, and records of the cherry blossom festivals date back more than a thousand years. In fact, the record of the timing of the cherry blossoms in Japan is the oldest for any flowering plant! Two scientists and historians. Richard Primack and Hiroyoshi Higuchi recently analyzed this record and found that beginning in the early 1800s the mean air temperature in March has slowly risen, similar to the increase shown in Figure Northern Hemisphere Surface Air. During this same time period, the flowering date has slowly crept earlier in the season, and the trees are now flowering several days before they traditionally flowered. Although urbanization of Japan has lead to an increase in temperature, recent climate change is blamed for the earlier flowering of the Japanese cherry blossom tree. Primack and Higuchi show how Kyoto has warmed an average of 3.4°C over the last 170 years. Climate change has contributed 18% to this total warming in Japan and Primack and Higuchi demonstrate the correlation of this warming with the industrial revolution.

Birds, Mosquitoes, and Fire Ants
A recent article in the journal Nature discussed the response of plants and animals to current climate change. Phenologists, scientists who study how the periodic life cycle events of animals and plants are affected by variations in climate over the course of seasons and years, are finding that many species of birds are breeding and singing earlier in the year. Migrant birds are arriving earlier, butterflies are appearing earlier and some amphibians are spawning weeks ahead of their historical schedule. In addition, mountain tree lines, which are controlled by air temperature, have been advancing to higher altitudes in Europe, and Arctic shrubs are now found in regions that were once too cold for their existence in Alaska. While ecological changes such as these may not be threatening from a human perspective, others are. For example, malaria-carrying mosquitoes in Africa are now being found at altitudes that were once too cold for them, and outbreaks of malaria are showing up in towns and villages once thought to be out of their reach. In parts of California and Australia, fire ants are migrating to regions that historically have been too cold to support them.


Impacts of Change in the Arctic and the Antarctic
The Arctic and Antarctic are the regions experiencing the most rapid changes due to the recent warming of the earth’s atmosphere. These two regions on Earth are a part of the cryosphere, which is defined as the part of the Earth that is occupied by sea ice, lake ice, ice caps and permafrost. (For a comprehensive overview of the current state of the cryosphere and an excellent archive of data, please check out “The Cryosphere Today”) As explained in the Module Milankovitch Cycles and the Climate of the Quaternary, these regions are most vulnerable due to the powerful ice-albedo effect. One amazing depiction of polar warming can be found in the drunken forests of Siberia. Larch and spruce trees there are often seen tilted over on their sides and growing at strange angles. Why? Because the once continually frozen soil, or permafrost, in which they are rooted has been melting in recent years. As the soil thaws it becomes more malleable and the trees begin to slant as the soil beneath them sinks. Farther north, Arctic sea ice has been decreasing both in extent and concentration. In 2007, the smallest extent of sea ice was measured since the 1970s, and the Northwest Passage opened for commerce and exploration. As the sea ice extent and concentration decreases, so does the habitat of polar bears. The sea ice is a vital part of their hunting grounds, and recent decreases of this ice have greatly reduced their access to certain prey. In addition to sea ice reductions, surface melt of the ice sheet on Greenland has increased in recent years, especially along its edges. This melt has lead to large pools and streams forming on top of this mile-thick sheet of ice. On the other side of the world, the Larsen B ice shelf in Antarctica recently collapsed, sending a large section of ice into the sea. This section of the Antarctic ice cap was roughly as large as the state of Rhode Island and it had been stably attached to the ice shelf for the past 12,000 years. Scientists are closely watching the Antarctic ice as nearly two-thirds of the world’s fresh water resides there. Finally, alpine glacier retreat has been observed on every continent. With few exceptions, these glaciers have been retracting heavily since the 1960s, and over that time period NASA reports a global loss of 8,000 cubic kilometers of ice, which represents a what percentage reduction?


The Oceans’ Response
Further dramatic changes brought on by recent warming have been observed by scientists concerned with the world’s oceans. Observations of the world’s coral reefs have revealed an alarming rate of coral bleaching (which is not caused by chlorine). As the oceans attempt to uptake the abundance of CO2 and absorb nearly 80% of the heat added to the earth-atmosphere system from the enhanced greenhouse effect, the waters will inevitably warm. As these waters have warmed over the past 40 years, the delicate ecological balance within some of the world’s coral reefs has been upset leading to coral bleaching. Under warmer waters the rate at which the algae, which is an important part of the coral ecosystem, undergoes photosynthesis is too much for the coral to manage. As a result, the coral rids itself of the algae, which leads to an exposure of the white skeleton of the coral. Another consequence of warming oceans is an increase in sea level. Since 1880, sea level has risen 20 cm (8 inches). The rise in sea level is associated both with an increase in glacial melt water and in the thermal expansion of the seawater. An interesting consequence of this rise in sea level has been the disappearance of the long-disputed New Moore Island between Bangladesh and India. Both countries laid claim to the shallow, uninhabited island due to the speculation that oil reserves may lie beneath it, but in 2010, the sea swallowed it. Scientists at the School of Oceanographic Studies at Jadavpur University, Kolkatta, India suggest global warming played an important part.

Finally, as the planet has adjusted to warmer temperatures the proliferation of drought conditions in some regions has dramatically affected human populations. The Sahel, for example, is a border region between the Sahara Desert in the north of Africa and the tropical rainforests that occupy the central part of the continent. (see Figure The Sahel in Africa) This region is experiencing desertification as the Sahara steadily expands southward. Since the 1970s, the amount of precipitation in this region has been steadily below normal. The combination of over irrigation and recent climate change has made the region uninhabitable and forced millions to relocate.


Who is Responsible? Factors to Consider
In 2007, the IPCC was awarded a share of the Nobel Prize for its work in the area of global climate change. The IPCC is organized through the United Nations and is composed of over 3,000 scientists from around the world who are working together to understand current climate change and project future climate scenarios. As of 2011, the IPCC has released four comprehensive reports, and it has concluded, “Most of the observed increase in global average temperature since the mid-twentieth century is very likely due to the observed increase in anthropogenic greenhouse gas concentrations.” This widely known statement essentially means that the probability of occurrence is greater than 90% that the current global warming is caused by humans burning fossil fuels. In response to these findings, the United Nations Framework Convention on Climate Change has called for numerous international meetings in cities including Kyoto, Bali, Copenhagen, and others where the leaders of world have gathered to discuss strategies to mitigate this looming disaster. At these meetings, scientists, politicians and world leaders review the current state of knowledge about the problem and strategize for the future. This chapter will take a large-scale view of the global challenges of climate change.
Over the past few years, China has surpassed the United States to become the nation that emits more greenhouse gasses than any other (see Figure CO2 Emissions for the United States and China). Currently, China is responsible for just over 25% of global CO2 emissions, which are approximately 30 Gt per year, with the United States in a close second place. It is important to consider population when reviewing these numbers because there are over four times as many people living in China than in the United States. When you compare these two countries on a per capita basis, the average U.S. citizen emits approximately 19 metric tons of CO2 per year while the average Chinese citizen emits approximately five metric tons. In 2009, the United States consumed more than double the amount oil than the second largest consumer, China, according to the U.S. Energy Information Administration. Topping the list in per capita CO2 emissions is the oil rich nation of Qatar. This small country located on the Persian Gulf has the largest per capita production of oil and natural gas. It also has the world’s highest gross domestic product (GDP) per capita. An average citizen in this country emits nearly 60 metric tons of CO2 into the atmosphere each year.

Rather than point the finger at individual countries, let’s examine the bigger problem. The maps in Figure Global Influence Mapsdistort the size of each country based on a certain variable, like CO2 emissions, with respect to the rest of the world. In the upper left panel, the map is based on population, which is why China and India appear so large. The upper right map distorts the size of the country based upon fuel imports. Notice that the United States, much of Europe, and Japan are expanded the most, while Africa, the Middle East, and much of South America are barely visible. Compare these two maps with absolute wealth and carbon emissions and the story is quite clear. The industrialized and wealthy nations are responsible for the largest quantities of carbon emissions and fuel imports. These societies are built on the foundation of energy production through the consumption of fossil fuels.
The bottom two panels tell another aspect of this story. Focus first on the graph in the lower right, which shows forest loss by country. The world’s forest biomes are a large part of the CO2 cycle and with deforestation, a large sink for atmospheric CO2 is taken away. Notice that deforestation is most prevalent in Africa, South America, and Indonesia while the United States is barely visible on this map. In the United States, reforestation is practiced, but in the rainforests of the world, which are those areas in South America, Africa, and Indonesia that are ballooned on this map, deforestation is commonplace.

The last graph in Figure Global Influence Maps distorts each country’s size according to poverty. Much of Asia and Africa are distorted the most, and it is in these regions that we need to pay close attention over the upcoming years. Many of the nations found within these countries are what economists and politicians call “emerging economies.” Although much of the current abundance of CO2 in the atmosphere is from developed countries such as the United States,
Future Temperature Changes
Climate models project the following key temperature-related changes:
Key Global Projections
-
Average global temperatures are expected to increase by 2°F to 11.5°F by 2100, depending on the level of future greenhouse gas emissions, and the outcomes from various climate models.
- By 2100, global average temperature is expected to warm at least twice as much as it has during the last 100 years.
- Ground-level air temperatures are expected to continue to warm more rapidly over land than oceans.
- Some parts of the world are projected to see larger temperature increases than the global average.
Patterns of precipitation and storm events, including both rain and snowfall are likely to change. However, some of these changes are less certain than the changes associated with temperature. Projections show that future precipitation and storm changes will vary by season and region. Some regions may have less precipitation, some may have more precipitation, and some may have little or no change. The amount of rain falling in heavy precipitation events is likely to increase in most regions, while storm tracks are projected to shift towards the poles. Climate models project the following precipitation and storm changes
Key Global Projections
-
Global average annual precipitation through the end of the century is expected to increase, although changes in the amount and intensity of precipitation will vary by region.
-
The intensity of precipitation events will likely increase on average. This will be particularly pronounced in tropical and high-latitude regions, which are also expected to experience overall increases in precipitation.
-
The strength of the winds associated with tropical storms is likely to increase. The amount of precipitation falling in tropical storms is also likely to increase.
-
Annual average precipitation is projected to increase in some areas and decrease in others.

Figure 2. All the hurricane tracks ever recorded. Credit: NOAA
Future Ice, Snowpack, and Permafrost
Arctic sea ice is already declining drastically. The area of snow cover in the Northern Hemisphere has decreased since 1970. Permafrost temperature has increased over the last century, making it more susceptible to thawing. Over the next century, it is expected that sea ice will continue to decline, glaciers will continue to shrink, snow cover will continue to decrease, and permafrost will continue to thaw. Potential changes to ice, snow, and permafrost are described below.
Key Global Projections
For every 2°F of warming, models project about a 15% decrease in the extent of annually averaged sea ice and a 25% decrease in September Arctic sea ice. The coastal sections of the Greenland and Antarctic ice sheets are expected to continue to melt or slide into the ocean. If the rate of this ice melting increases in the 21st century, the ice sheets could add significantly to global sea level rise. Glaciers are expected to continue to decrease in size. The rate of melting is expected to continue to increase, which will contribute to sea level rise.

Figure 19: Global Surface Temperature Comparisons Comparison of regional and global scale surface temperature 1900-2000. Pink shading indicates the model predicted surface temperature using only natural forcings. The blue indicates model predicted surface temperature using natural and anthropogenic forcings. The black lines represent the actual observations. Source: Climate Change 2007: The Physical Science Basis: Contribution of Working Group I to the Fourth Assessment Report of the Intergovernmental Panel on ClimateChange, Cambridge University Press, FAQ 9.2, figure 1, page 121
Future Sea Level Change
Warming temperatures contribute to sea level rise by expanding ocean water, melting mountain glaciers and ice caps, and causing portions of the Greenland and Antarctic ice sheets to melt or flow into the ocean. Since 1870, global sea level has risen by about 8 inches. Estimates of future sea level rise vary for different regions, but global sea level for the next century is expected to rise at a greater rate than during the past 50 years. The contribution of thermal expansion, ice caps, and small glaciers to sea level rise is relatively well-studied, but the impacts of climate change on ice sheets are less understood and represent an active area of research. Thus it is more difficult to predict how much changes in ice sheets will contribute to sea level rise. Greenland and Antarctic ice sheets could contribute an additional 1 foot of sea level rise, depending on how the ice sheets respond.

Figure 18: Sea Levels since 1880 Measured sea level rise since 1880. The different colors represent different data sets used to make this graph. Source: Climate Change 2007: The Physical Science Basis: Contribution of Working Group I to the Fourth Assessment Report of the Intergovernmental Panel on Climate Change, Cambridge University Press, figure 5.13, page 410
Regional and local factors will influence future relative sea level rise for specific coastlines around the world. For example, relative sea level rise depends on land elevation changes that occur as a result of subsidence (sinking) or uplift (rising). Assuming that these historical geological forces continue, a 2-foot rise in global sea level by 2100 would result in the following relative sea level rise:
- 2.3 feet at New York City
- 2.9 feet at Hampton Roads, Virginia
- 3.5 feet at Galveston, Texas
- 1 foot at Neah Bay in Washington state
Relative sea level rise also depends on local changes in currents, winds, salinity, and water temperatures, as well as proximity to thinning ice sheets.
Future Ocean Acidification
Ocean acidification is the process of ocean waters decreasing in pH. Oceans become more acidic as carbon dioxide (CO2) emissions in the atmosphere dissolve in the ocean. This change is measured on the pH scale, with lower values being more acidic. The pH level of the oceans has decreased by approximately 0.1 pH units since pre-industrial times, which is equivalent to a 25% increase in acidity. The pH level of the oceans is projected to decrease even more by the end of the century as CO2 concentrations are expected to increase for the foreseeable future. Ocean acidification adversely affects many marine species, including plankton, mollusks, shellfish, and corals. As ocean acidification increases, the availability of calcium carbonate will decline. Calcium carbonate is a key building block for the shells and skeletons of many marine organisms. If atmospheric CO2 concentrations double, coral calcification rates are projected to decline by more than 30%. If CO2 concentrations continue to rise at their current rate, corals could become rare on tropical and subtropical reefs by 2050.
Spread of Disease
This rise in global temperatures will increase the range of disease-carrying insects and the viruses and pathogenic parasites they harbor. Thus, diseases will spread to new regions of the globe. This spread has already been documented with dengue fever, a disease the affects hundreds of millions per year, according to the World Health Organization. Colder temperatures typically limit the distribution of certain species, such as the mosquitoes that transmit malaria, because freezing temperatures destroy their eggs.
Not only will the range of some disease-causing insects expand, the increasing temperatures will also accelerate their lifecycles, which allows them to breed and multiply quicker, and perhaps evolve pesticide resistance faster. In addition to dengue fever, other diseases are expected to spread to new portions of the world as the global climate warms. These include malaria, yellow fever, West Nile virus, zika virus, and chikungunya.
Global Impacts of Climate Change
Globally, an increase of between 2°C and 6°C in mean surface temperature is expected by the year 2100. Regionally, these values may differ substantially, and some locations may actually cool over the next century. The hardest hit locations will be the in the high northerly latitudes of the Arctic. Figure Projected Temperature Increases depicts the variation in expected increases in surface air temperature for the time period of 2020-2029 and 2090-2099 with color shading. Notice that in all of these images, the greatest changes are expected to occur at high northerly latitudes. If these projections hold true, ice and snow cover will continue to retreat and enhance the ice-albedo effect discussed in Module Climate Processes; External and Internal Controls. Since the 1980s, NH snow-covered area has shrunk by 3 million square kilometers, and many northerly lakes are spending less time each year covered in ice.

Aside from air temperature, global precipitation patterns and amounts are expected to change. As the atmosphere warms, its ability to hold water vapor increases, which leads to more evaporation from water on the earth’s surface. As this water condenses in the earth’s atmosphere to form clouds and precipitation, the distribution of the precipitation will vary greatly. Current projections forecast an increase in precipitation in the tropics and polar latitudes, with drier conditions over the mid-latitudes. Even though there will be more water vapor in the atmosphere, the distribution of precipitation may be such that large regions formerly unused to drought may be subjected to prolonged dry periods. Focus on the middle panels of Figure Winter and Summer Precipitation Anomalies, which shows the winter (top) and summer (bottom) precipitation anomalies. Notice that the tropics and polar regions are expected to have above normal precipitation, while the mid-latitudes have below normal precipitation. Although more areas are expected to experience prolonged drought, these projections suggest that when it does rain, rainfall will arrive in much greater amounts over shorter time periods. This will lead to increased flash flooding, the deadliest weather phenomenon in the United States.

The goal of climate science is not to craft public policy on global warming. It is to provide the public and policymakers alike with reasonable projections about future climate conditions. This information should be used to show the potential impacts of our presence on the climate system so as to form the best possible mitigation plans. Current projections show that if we are able to slow greenhouse gas emissions, the climate system will respond with the least amount of warming. They also suggest that if we continue with “business as usual” the change in the global climate will be great in magnitude and occur very quickly—both beyond past “natural” change.
Climate change affects everyone
Our lives are connected to the climate. Human societies have adapted to the relatively stable climate we have enjoyed since the last ice age which ended several thousand years ago. A warming climate will bring changes that can affect our water supplies, agriculture, power and transportation systems, the natural environment, and even our own health and safety.
Carbon dioxide can stay in the atmosphere for nearly a century, so Earth will continue to warm in the coming decades. The warmer it gets, the greater the risk for more severe changes to the climate and Earth’s system. Although it’s difficult to predict the exact impacts of climate change, what’s clear is that the climate we are accustomed to is no longer a reliable guide for what to expect in the future.
We can reduce the risks we will face from climate change. By making choices that reduce greenhouse gas pollution, and preparing for the changes that are already underway, we can reduce risks from climate change. Our decisions today will shape the world our children and grandchildren will live in.
You Can Take Action
You can take steps at home, on the road, and in your office to reduce greenhouse gas emissions and the risks associated with climate change. Many of these steps can save you money. Some, such as walking or biking to work, can even improve your health! You can also get involved on a local or state level to support energy efficiency, clean energy programs, or other climate programs.
Suggested Supplementary Reading
NASA. 2018. Global Climate Change: Vital Signs of the Planet. Website.
This website by NASA provides a multi-media smorgasbord of engaging content. Learn about climate change using data collected by NASA satellites and more.
Attribution
Essentials of Environmental Science by Kamala Doršner is licensed under CC BY 4.0. Modified from the original by Matthew R. Fisher.
Candela Citations
- Authored by: Eric Snodgrass. Located at: https://cnx.org/contents/JFkrFJcl@1.1:4o_glx6d@8/Climate-Projections. License: Public Domain: No Known Copyright