Introduction
Energy for lighting, heating and cooling our buildings, manufacturing products, and powering our transportation systems comes from a variety of natural sources. The earth’s core provides geothermal energy. The gravitational pull of moon and sun create tides. The sun emits light (electromagnetic radiation), which creates wind, powers the water (hydrologic) cycle, and enables photosynthesis. Plants, algae, and cyanobacteria utilize solar energy to grow and create biomass that can be burned and used for biofuels, such as wood, biodiesel, bioethanol. Over the course of millions of years, biomass from photosynthetic organisms can create energy-rich fossil fuels through the geologic process of burial and transformation through heat and pressure.
The principal energy resources used in the world are shown in Figure. The fuel mix has changed over the years but now is dominated by oil, although natural gas and solar contributions are increasing. Renewable forms of energy are those sources that cannot be used up, such as water, wind, solar, and biomass. About 85% of our energy comes from nonrenewable fossil fuels—oil, natural gas, coal. All energy sources have and some environmental and health cost, and the distribution of energy is not equally distributed among all nations.

Figure 1: World energy consumption by source, in billions of kilowatt-hours: 2006. (credit: KVDP)
The World’s Growing Energy Needs
World energy consumption continues to rise, especially in the developing countries. (See Figure.) Global demand for energy has tripled in the past 50 years and might triple again in the next 30 years. While much of this growth will come from the rapidly booming economies of China and India, many of the developed countries, especially those in Europe, are hoping to meet their energy needs by expanding the use of renewable sources. Although presently only a small percentage, renewable energy is growing very fast, especially wind energy. For example, Germany plans to meet 20% of its electricity and 10% of its overall energy needs with renewable resources by the year 2020. (See Figure.) Energy is a key constraint in the rapid economic growth of China and India. In 2003, China surpassed Japan as the world’s second largest consumer of oil. However, over 1/3 of this is imported. Unlike most Western countries, coal dominates the commercial energy resources of China, accounting for 2/3 of its energy consumption. In 2009 China surpassed the United States as the largest generator of CO2size 12{“CO” rSub { size 8{2} } } {}. In India, the main energy resources are biomass (wood and dung) and coal. Half of India’s oil is imported. About 70% of India’s electricity is generated by highly polluting coal. Yet there are sizeable strides being made in renewable energy. India has a rapidly growing wind energy base, and it has the largest solar cooking program in the world.


Table displays the 2006 commercial energy mix by country for some of the prime energy users in the world. While non-renewable sources dominate, some countries get a sizeable percentage of their electricity from renewable resources. For example, about 67% of New Zealand’s electricity demand is met by hydroelectric. Only 10% of the U.S. electricity is generated by renewable resources, primarily hydroelectric. It is difficult to determine total contributions of renewable energy in some countries with a large rural population, so these percentages in this table are left blank.
| Country | Consumption, in EJ (1018 J) | Oil | Natural Gas | Coal | Nuclear | Hydro | Other Renewables | Electricity Use per capita (kWh/yr) | Energy Use per capita (GJ/yr) |
|---|---|---|---|---|---|---|---|---|---|
| Australia | 5.4 | 34% | 17% | 44% | 0% | 3% | 1% | 10000 | 260 |
| Brazil | 9.6 | 48% | 7% | 5% | 1% | 35% | 2% | 2000 | 50 |
| China | 63 | 22% | 3% | 69% | 1% | 6% | 1500 | 35 | |
| Egypt | 2.4 | 50% | 41% | 1% | 0% | 6% | 990 | 32 | |
| Germany | 16 | 37% | 24% | 24% | 11% | 1% | 3% | 6400 | 173 |
| India | 15 | 34% | 7% | 52% | 1% | 5% | 470 | 13 | |
| Indonesia | 4.9 | 51% | 26% | 16% | 0% | 2% | 3% | 420 | 22 |
| Japan | 24 | 48% | 14% | 21% | 12% | 4% | 1% | 7100 | 176 |
| New Zealand | 0.44 | 32% | 26% | 6% | 0% | 11% | 19% | 8500 | 102 |
| Russia | 31 | 19% | 53% | 16% | 5% | 6% | 5700 | 202 | |
| U.S. | 105 | 40% | 23% | 22% | 8% | 3% | 1% | 12500 | 340 |
| World | 432 | 39% | 23% | 24% | 6% | 6% | 2% | 2600 | 71 |
Environmental and Health Challenges of Energy Use
The environmental impacts of energy use on humans and the planet can happen anywhere during the life cycle of the energy source. The impacts begin with the extraction of the resource. They continue with the processing, purification or manufacture of the source; its transportation to place of energy generation, and ends with the disposal of waste generated during use.
Extraction of fossil fuels can be used as a case study because its use has significant impacts on the environment. As we mine deeper into mountains, farther out at sea, or farther into pristine habitats, we risk damaging fragile environments, and the results of accidents or natural disasters during extraction processes can be devastating. Fossils fuels are often located far from where they are utilized so they need to be transported by pipeline, tankers, rail or trucks. These all present the potential for accidents, leakage and spills. When transported by rail or truck energy must be expended and pollutants are generated. Processing of petroleum, gas and coal generates various types of emissions and wastes, as well as utilizes water resources. Production of energy at power plants results in air, water, and, often, waste emissions. Power plants are highly regulated in the Unites States by federal and state law under the Clean Air and Clean Water Acts, while nuclear power plants are regulated by the Nuclear Regulatory Commission. Figure 1 summarizes the environmental impacts of several types of fuels, both renewable and non-renewable.
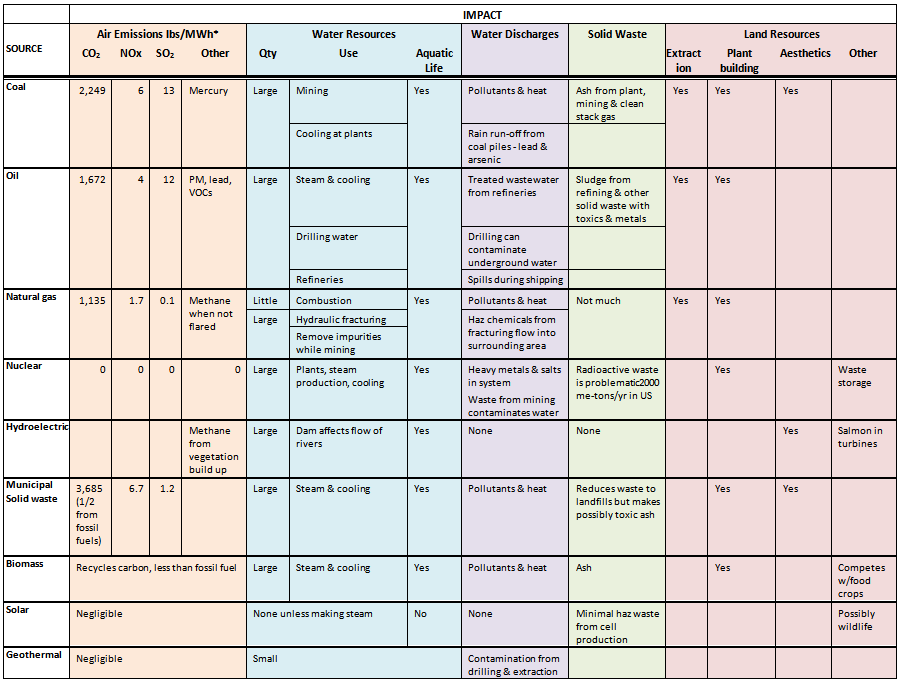
Figure 4. Environmental Impacts of Nonrenewable and Renewable Electricity Sources Source: C. Klein-Banai using data from U.S. Energy Information Administration and U.S. Environmental Protection Agency
Geopolitical Challenges of Fossil Fuels
The use of fossil fuels has allowed much of the global population to reach a higher standard of living. However, this dependence on fossil fuels results in many significant impacts on society. Our modern technologies and services, such as transportation and plastics depend in many ways on fossil fuels. If supplies become limited or extremely costly, our economies are vulnerable. If countries do not have fossil fuel reserves of their own, they incur even more risk. The United States has become more and more dependent on foreign oil since 1970 when our own oil production peaked. The United States imported over half of the crude oil and refined petroleum products that we consumed during 2009. Just over half of these imports came from the Western Hemisphere (Figure 2).
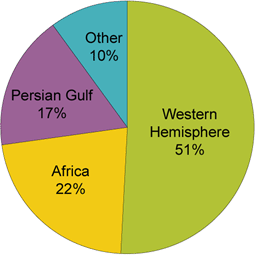
Figure 5. Sources of United States Net Petroleum Imports, 2009 Figure illustrates that the United States imported over half of the crude oil and refined petroleum products that it consumed during 2009. Source: U.S. Energy Information Administration, Petroleum Supply Annual, 2009, preliminary data.
The major holder of oil reserves is the Organization of Petroleum Exporting Countries, (OPEC) (Figure 3). As of January 2009, there were 12 member countries in OPEC: Algeria, Angola, Ecuador, Iran, Iraq, Kuwait, Libya, Nigeria, Qatar, Saudi Arabia, the United Arab Emirates, and Venezuela. OPEC attempts to influence the amount of oil available to the world by assigning a production quota to each member except Iraq, for which no quota is presently set. Overall compliance with these quotas is mixed since the individual countries make the actual production decisions. All of these countries have a national oil company but also allow international oil companies to operate within their borders. They can restrict the amounts of production by those oil companies. Therefore, the OPEC countries have a large influence on how much of world demand is met by OPEC and non-OPEC supply. A recent example of this is the price increases that occurred during the year 2011 after multiple popular uprisings in Arab countries, including Libya.

Figure 6. Proven Oil Reserves Holders Pie chart shows proven oil reserves holders. Source: C. Klein-Banai using data from BP Statistical Review of World Energy (2010)
This pressure has lead the United States to developing policies that would reduce reliance on foreign oil such as developing additional domestic sources and obtaining it from non-Middle Eastern countries such as Canada, Mexico, Venezuela, and Nigeria. However, since fossil fuel reserves create jobs and provide dividends to investors, a lot is at stake in a nation that has oil reserves. Oil wealth may be shared with the country’s inhabitants or retained by the oil companies and dictatorships, such as in Nigeria prior to the 1990s.
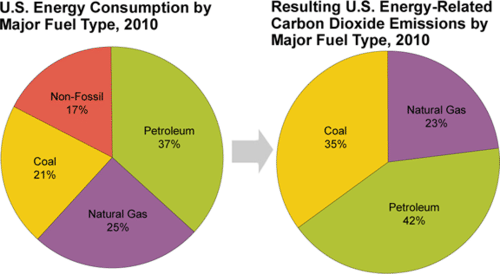
Figure 7. Fuel Type and Carbon Emissions The two charts show the relationship between fuel type and carbon emissions for U.S. energy consumption in 2010. Source: U.S. Energy Information Administration
Attribution
Essentials of Environmental Science by Kamala Doršner is licensed under CC BY 4.0. Modified from the original by Matthew R. Fisher.
Candela Citations
- Authored by: OpenStax Tutor. Located at: https://cnx.org/contents/JFkrFJcl@1.1:PObM1Tq9@1/World-Energy-Use. License: Public Domain: No Known Copyright