Introduction
Strong interest in renewable energy in the modern era arose in response to the oil shocks of the 1970s, when the Organization of Petroleum Exporting Countries (OPEC) imposed oil embargos and raised prices in pursuit of geopolitical objectives. The shortages of oil, especially gasoline for transportation, and the eventual rise in the price of oil by a factor of approximately 10 from 1973 to 1981 disrupted the social and economic operation of many developed countries and emphasized their precarious dependence on foreign energy supplies. The reaction in the United States was a shift away from oil and gas to plentiful domestic coal for electricity production and the imposition of fuel economy standards for vehicles to reduce consumption of oil for transportation. Other developed countries without large fossil reserves, such as France and Japan, chose to emphasize nuclear (France to the 80 percent level and Japan to 30 percent) or to develop domestic renewable resources such as hydropower and wind (Scandinavia), geothermal (Iceland), solar, biomass and for electricity and heat. As oil prices collapsed in the late 1980s interest in renewables, such as wind and solar that faced significant technical and cost barriers, declined in many countries, while other renewables, such as hydro and biomass, continued to experience growth.
The increasing price and volatility of oil since 1998, and the increasing dependence of many developed countries on foreign oil (60 percent of United States and 97 percent of Japanese oil was imported in 2008) spurred renewed interest in renewable alternatives to ensure energy security. A new concern, not known in previous oil crises, added further motivation: our knowledge of the emission of greenhouse gases and their growing contribution to global warming, and the threat of climate change. An additional economic motivation, the high cost of foreign oil payments to supplier countries (approximately $350 billion/year for the United States at 2011 prices), grew increasingly important as developed countries struggled to recover from the economic recession of 2008. These energy security, carbon emission, and climate change concerns drive significant increases in fuel economy standards, fuel switching of transportation from uncertain and volatile foreign oil to domestic electricity and biofuels, and production of electricity from low carbon sources.
Physical Origin of Renewable Energy
Although renewable energy is often classified as hydro, solar, wind, biomass, geothermal, wave and tide, all forms of renewable energy arise from only three sources: the light of the sun, the heat of the earth’s crust, and the gravitational attraction of the moon and sun. Sunlight provides by far the largest contribution to renewable energy, illustrated in Figure Forms of Renewable Energy Provided by the Sun. The sun provides the heat that drives the weather, including the formation of high- and low-pressure areas in the atmosphere that make wind. The sun also generates the heat required for vaporization of ocean water that ultimately falls over land creating rivers that drive hydropower, and the sun is the energy source for photosynthesis, which creates biomass. Solar energy can be directly captured for water and space heating, for driving conventional turbines that generate electricity, and as excitation energy for electrons in semiconductors that drive photovoltaics. The sun is also responsible for the energy of fossil fuels, created from the organic remains of plants and sea organisms compressed and heated in the absence of oxygen in the earth’s crust for tens to hundreds of millions of years. The time scale for fossil fuel regeneration, however, is too long to consider them renewable in human terms.
Geothermal energy originates from heat rising to the surface from earth’s molten iron core created during the formation and compression of the early earth as well as from heat produced continuously by radioactive decay of uranium, thorium and potassium in the earth’s crust. Tidal energy arises from the gravitational attraction of the moon and the more distant sun on the earth’s oceans, combined with rotation of the earth. These three sources – sunlight, the heat trapped in earth’s core and continuously generated in its crust, and gravitational force of the moon and sun on the oceans – account for all renewable energy.

Capacity and Geographical Distribution
Although renewable energies such as wind and solar have experienced strong growth in recent years, they still make up a small fraction of the world’s total energy needs. Figure Renewable Energy Share of Global Final Energy Consumption, 2008 shows the contribution of fossil, nuclear and renewable energy to final global energy consumption in 2008. The largest share comes from traditional biomass, mostly fuel wood gathered in traditional societies for household cooking and heating, often without regard for sustainable replacement. Hydropower is the next largest contributor, an established technology that experienced significant growth in the 20th Century. The other contributors are more recent and smaller in contribution: water and space heating by biomass combustion or harvesting solar and geothermal heat, biofuels derived from corn or sugar cane, and electricity generated from wind, solar and geothermal energy. Wind and solar electricity, despite their large capacity and significant recent growth, still contributed less than one percent of total energy in 2008.

The potential of renewable energy resources varies dramatically. Solar energy is by far the most plentiful, delivered to the surface of the earth at a rate of 120,000 Terawatts (TW), compared to the global human use of 15 TW. To put this in perspective, covering 100×100 km2 of desert with 10 percent efficient solar cells would produce 0.29 TW of power, about 12 percent of the global human demand for electricity. To supply all of the earth’s electricity needs (2.4 TW in 2007) would require 7.5 such squares, an area about the size of Panama (0.05 percent of the earth’s total land area). The world’s conventional oil reserves are estimated at three trillion barrels, including all the oil that has already been recovered and that remain for future recovery. The solar energy equivalent of these oil reserves is delivered to the earth by the sun in 1.5 days.
The global potential for producing electricity and transportation fuels from solar, wind and biomass is limited by geographical availability of land suitable for generating each kind of energy (described as the geographical potential), the technical efficiency of the conversion process (reducing the geographical potential to the technical potential), and the economic cost of construction and operation of the conversion technology (reducing the technical potential to the economic potential). The degree to which the global potential of renewable resources is actually developed depends on many unknown factors such as the future extent of economic and technological advancement in the developing and developed worlds, the degree of globalization through business, intellectual and social links among countries and regions, and the relative importance of environmental and social agendas compared to economic and material objectives. Scenarios evaluating the development of renewable energy resources under various assumptions about the world’s economic, technological and social trajectories show that solar energy has 20-50 times the potential of wind or biomass for producing electricity, and that each separately has sufficient potential to provide the world’s electricity needs in 2050 (de Vries, 2007)
The geographical distribution of useable renewable energy is quite uneven. Sunlight, often thought to be relatively evenly distributed, is concentrated in deserts where cloud cover is rare. Winds are up to 50 percent stronger and steadier offshore than on land. Hydroelectric potential is concentrated in mountainous regions with high rainfall and snowmelt. Biomass requires available land that does not compete with food production, and adequate sun and rain to support growth. Figure Renewable Electricity Opportunities shows the geographical distribution of renewable electricity opportunities that are likely to be economically attractive in 2050 under an aggressive world development scenario.

Hydropower
Hydropower (hydroelectric) relies on water to spin turbines and create electricity. It is considered a clean and renewable source of energy because it does not directly produce pollutants and because the source of power is regenerated. Hydropower provides 35% of the United States’ renewable energy consumption.

Figure 1. Hoover Power Plant View of Hoover Power Plant on the Colorado River as seen from above. Source: U.S. Department of the Interior
Hydropower dams and the reservoirs they create can have environmental impacts. For example, migration of fish to their upstream spawning areas can be obstructed by dams. In areas where salmon must travel upstream to spawn, such as along the Columbia River in Washington and Oregon, the dams block their way. This problem can be partially alleviated by using “fish ladders” that help salmon get around the dams. Fish traveling downstream, however, can get killed or injured as water moves through turbines in the dam. Reservoirs and operation of dams can also affect aquatic habitats due to changes in water temperatures, water depth, chemistry, flow characteristics, and sediment loads, all of which can lead to significant changes in the ecology and physical characteristics of the river both upstream and downstream. As reservoirs fill with water it may cause natural areas, farms, cities, and archeological sites to be inundated and force populations to relocate.
Hydro turbines kill and injure some of the fish that pass through the turbine although there are ways to reduce that effect. In areas where salmon must travel upstream to spawn, such as along the Columbia River in Washington and Oregon, the dams get in the way. This problem can be partially alleviated by using “fish ladders” that help the salmon get up the dams.
Carbon dioxide and methane may also form in reservoirs where water is more stagnant and be emitted to the atmosphere. The exact amount of greenhouse gases produced from hydropower plant reservoirs is uncertain. If the reservoirs are located in tropical and temperate regions, including the United States, those emissions may be equal to or greater than the greenhouse effect of the carbon dioxide emissions from an equivalent amount of electricity generated with fossil fuels (EIA, 2011).
Small hydropower systems
Large-scale dam hydropower projects are often criticized for their impacts on wildlife habitat, fish migration, and water flow and quality. However, small run-of- the-river projects are free from many of the environmental problems associated with their large-scale relatives because they use the natural flow of the river, and thus produce relatively little change in the stream channel and flow. The dams built for some run-of-the-river projects are very small and impound little water, and many projects do not require a dam at all. Thus, effects such as oxygen depletion, increased temperature, decreased flow, and impeded upstream migration are not problems for many run-of-the-river projects.
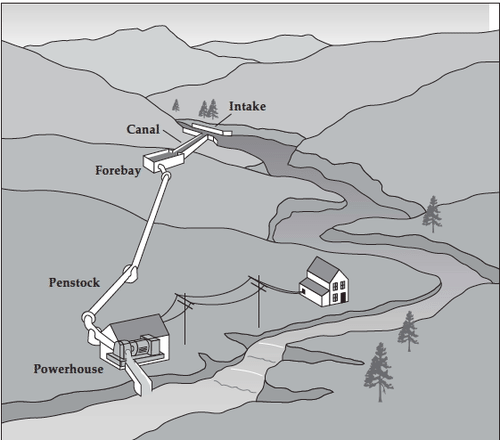
Figure 2. Microhydropower system. Although there are several ways to harness the moving water to produce energy, run-of-the-river systems, which do not require large storage reservoirs, are often used for microhydro, and sometimes for small-scale hydro, projects. For run-of-the-river hydro projects, a portion of a river’s water is diverted to a channel, pipeline, or pressurized pipeline (penstock) that delivers it to a waterwheel or turbine. The moving water rotates the wheel or turbine, which spins a shaft. The motion of the shaft can be used for mechanical processes, such as pumping water, or it can be used to power an alternator or generator to generate electricity.
Small hydropower projects offer emissions-free power solutions for many remote communities throughout the world, such as those in Nepal, India, China, and Peru, as well as for highly industrialized countries like the United States. Small hydropower systems are those that generate between .01 to 30 MW of electricity. Hydropower systems that generate up to 100 kilowatts (kW) of electricity are often called micro hydropower systems (Figure 2). Most of the systems used by home and small business owners would qualify as microhydropower systems. In fact, a 10 kW system generally can provide enough power for a large home, a small resort, or a hobby farm.
Municipal Solid Waste
Municipal solid waste (MSW) is commonly known as garbage and can create electricity by burning it directly or by burning the methane produced as it decays. Waste to energy processes are gaining renewed interest as they can solve two problems at once: disposal of waste and production of energy from a renewable resource. Many of the environmental impacts are similar to those of a coal plant: air pollution, ash generation, etc. Because the fuel source is less standardized than coal and hazardous materials may be present in MSW, incinerators and waste-to-energy power plants need to clean the gases of harmful materials. The U.S. EPA regulates these plants very strictly and requires anti-pollution devices to be installed. Also, while incinerating at high temperature many of the toxic chemicals may break down into less harmful compounds. The ash from these plants may contain high concentrations of various metals that were present in the original waste. If ash is clean enough it can be “recycled” as an MSW landfill cover or to build roads, cement block and artificial reefs
Biomass
Biomass refers to material made by organisms, such as cells and tissues. In terms of energy production, biomass is almost always derived from plants, and to a lesser extent, algae. For biomass to be a sustainable option, it usually needs to come from waste material, such as lumber mill sawdust, paper mill sludge, yard waste, or oat hulls from an oatmeal processing plant, material that would otherwise just rot. Livestock manure and human waste could also be considered biomass. The use of biomass can help mitigate climate change because when burned it adds no new carbon to the atmosphere. Thinking back to the carbon cycle (chapter 3), you will recall that photosynthesis removes CO2 through the process of carbon fixation. When biomass is burnt, CO2 is created, but this is equal to the amount of CO2 captured during carbon fixation. Thus, biomass is a carbon neutral energy source because it doesn’t add new CO2 to the carbon cycle. Each type of biomass must be evaluated for its environmental and social impact in order to determine if it is really advancing sustainability and reducing environmental impacts. For example, cutting down large swaths of forests just for energy production is not a sustainable option because our energy demands are so great that we would quickly deforest the world, destroying critical habitat.

Figure 3. Woodchips Photograph shows a pile of woodchips, which are a type of biomass. Source: Ulrichulrich
Burning Wood
Using wood, and charcoal made from wood, for heating and cooking can replace fossil fuels and may result in lower CO2 emissions. If wood is harvested from forests or woodlots that have to be thinned or from urban trees that fall down or needed be cut down anyway, then using it for biomass does not impact those ecosystems. However, wood smoke contains harmful pollutants like carbon monoxide and particulate matter. For home heating, it is most efficient and least polluting when using a modern wood stove or fireplace insert that are designed to release small amounts of particulates. However, in places where wood and charcoal are major cooking and heating fuels such as in undeveloped countries, the wood may be harvested faster than trees can grow resulting in deforestation.
Biomass can be used in small power plants. For instance, Colgate College has had a wood-burning boiler since the mid-1980’s and in one year it processed approximately 20,000 tons of locally and sustainably harvested wood chips, the equivalent of 1.17 million gallons (4.43 million liters) of fuel oil, avoiding 13,757 tons of emissions and saving the university over $1.8 million in heating costs. The University’s steam-generating wood-burning facility now satisfies more than 75% of the campus’s heat and domestic hot water needs.
Landfill Gas or Biogas
Landfill gas (biogas) is a sort of man-made “biogenic” gas as discussed above. Methane is formed as a result of biological processes in sewage treatment plants, waste landfills, anaerobic composting, and livestock manure management systems. This gas is captured and burned to produce heat or electricity. The electricity may replace electricity produced by burning fossil fuels and result in a net reduction in CO2 emissions. The only environmental impacts are from the construction of the plant itself, similar to that of a natural gas plant.
Bioethanol and Biodiesel
Bioethanol and biodiesel are liquid biofuels manufactured from plants, typically crops. Bioethanol can be easily fermented from sugar cane juice, as is done in Brazil. Bioethanol can also be fermented from broken down corn starch, as is mainly done in the United States. The economic and social effects of growing plants for fuels need to be considered, since the land, fertilizers, and energy used to grow biofuel crops could be used to grow food crops instead. The competition of land for fuel vs. food can increase the price of food, which has a negative effect on society. It could also decrease the food supply increasing malnutrition and starvation globally. Also, in some parts of the world, large areas of natural vegetation and forests have been cut down to grow sugar cane for bioethanol and soybeans and palm-oil trees to make biodiesel. This is not sustainable land use. Biofuels may be derived from parts of plants not used for food, such as stalks, thus reducing that impact. Biodiesel can be made from used vegetable oil and has been produced on a very local basis. Compared to petroleum diesel, biodiesel combustion produces less sulfur oxides, particulate matter, carbon monoxide, and unburned and other hydrocarbons, but it produces more nitrogen oxide.
Liquid biofuels typically replace petroleum and are used to power vehicles. Although ethanol-gasoline mixtures burn cleaner than pure gasoline, they also are more volatile and thus have higher “evaporative emissions” from fuel tanks and dispensing equipment. These emissions contribute to the formation of harmful, ground level ozone and smog. Gasoline requires extra processing to reduce evaporative emissions before it is blended with ethanol.
Biodiesel can be made from used vegetable oil and has been produced on a very local basis. Compared to petroleum diesel, biodiesel combustion produces less sulfur oxides, particulate matter, carbon monoxide, and unburned and other hydrocarbons, but more nitrogen oxide.
Geothermal Energy
Five percent of the United States’ renewable energy comes from geothermal energy: using the heat of Earth’s subsurface to provide endless energy. Geothermal systems utilize a heat-exchange system that runs in the subsurface about 20 feet (5 meters) below the surface where the ground is at a constant temperature. The system uses the earth as a heat source (in the winter) or a heat sink (in the summer). This reduces the energy consumption required to generate heat from gas, steam, hot water, and conventional electric air-conditioning systems.The environmental impact of geothermal energy depends on how it is being used. Direct use and heating applications have almost no negative impact on the environment.

Figure 4: Installing a Geothermal Pipe System Drilling to install geothermal ground source pipe system. Source: Office of Sustainability, UIC
Geothermal power plants do not burn fuel to generate electricity so their emission levels are very low. They release less than 1% of the carbon dioxide emissions of a fossil fuel plant. Geothermal plants use scrubber systems to clean the air of hydrogen sulfide that is naturally found in the steam and hot water. They emit 97% less acid rain-causing sulfur compounds than are emitted by fossil fuel plants. After the steam and water from a geothermal reservoir have been used, they are injected back into the earth.
Geothermal ground source systems utilize a heat-exchange system that runs in the subsurface about 20 feet (5 meters) below the surface where the ground is at a constant temperature. The system uses the earth as a heat source (in the winter) or a heat sink (in the summer). This reduces the energy consumption requires to generate heat from gas, steam, hot water, and chiller and conventional electric air-conditioning systems.
Solar Energy
Solar power converts the energy of light into electrical energy and has minimal impact on the environment, depending on where it is placed. In 2009, 1% of the renewable energy generated in the United States was from solar power (1646 MW) out of the 8% of the total electricity generation that was from renewable sources. The manufacturing of photovoltaic (PV) cells generates some hazardous waste from the chemicals and solvents used in processing. Often solar arrays are placed on roofs of buildings or over parking lots or integrated into construction in other ways. However, large systems may be placed on land and particularly in deserts where those fragile ecosystems could be damaged if care is not taken. Some solar thermal systems use potentially hazardous fluids (to transfer heat) that require proper handling and disposal. Concentrated solar systems may need to be cleaned regularly with water, which is also needed for cooling the turbine-generator. Using water from underground wells may affect the ecosystem in some arid locations.
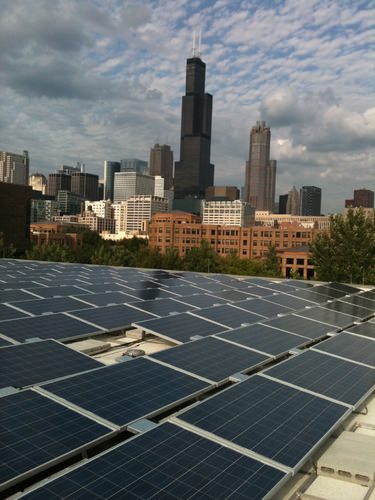
Figure 5. Rooftop Solar Installations Rooftop solar installation on Douglas Hall at the University of Illinois at Chicago has no effect on land resources, while producing electricity with zero emissions. Source: Office of Sustainability, UIC
Wind
Wind energy is a renewable energy source that is clean and has very few environmental challenges. Wind turbines are becoming a more prominent sight across the United States, even in regions that are considered to have less wind potential. Wind turbines (often called windmills) do not release emissions that pollute the air or water (with rare exceptions), and they do not require water for cooling. The U.S. wind industry had 40,181 MW of wind power capacity installed at the end of 2010, with 5,116 MW installed in 2010 alone, providing more than 20% of installed wind power around the globe. According to the American Wind Energy Association, over 35% of all new electrical generating capacity in the United States since 2006 was due to wind, surpassed only by natural gas.

Figure 6. Twin Groves Wind Farm, Illinois Wind power is becoming a more popular source of energy in the United States. Source: Office of Sustainability, UIC
Because a wind turbine has a small physical footprint relative to the amount of electricity it produces, many wind farms are located on crop and pasture land. They contribute to economic sustainability by providing extra income to farmers and ranchers, allowing them to stay in business and keep their property from being developed for other uses. For example, energy can be produced by installing wind turbines in the Appalachian mountains of the United States instead of engaging in mountain top removal for coal mining. Offshore wind turbines on lakes or the ocean may have smaller environmental impacts than turbines on land.
Wind turbines do have a few environmental challenges. There are aesthetic concerns to some people when they see them on the landscape. A few wind turbines have caught on fire, and some have leaked lubricating fluids, though this is relatively rare. Some people do not like the sound that wind turbine blades make. Turbines have been found to cause bird and bat deaths particularly if they are located along their migratory path. This is of particular concern if these are threatened or endangered species. There are ways to mitigate that impact and it is currently being researched. There are some small impacts from the construction of wind projects or farms, such as the construction of service roads, the production of the turbines themselves, and the concrete for the foundations. However, overall analysis has found that turbines make much more energy than the amount used to make and install them.
Wind and Solar Resources in the United States
The United States has abundant renewable resources. The solar resources of the United States, Germany and Spain are compared in Figure Solar Resources of the United States, Spain and Germany. The solar irradiation in the southwestern United States is exceptional, equivalent to that of Africa and Australia, which contain the best solar resources in the world. Much of the United States has solar irradiation as good or better than Spain, considered the best in Europe, and much higher than Germany. The variation in irradiation over the United States is about a factor two, quite homogeneous compared to other renewable resources. The size of the United States adds to its resource, making it a prime opportunity for solar development.

The wind resource of the United States, while abundant, is less homogeneous. Strong winds require steady gradients of temperature and pressure to drive and sustain them, and these are frequently associated with topological features such as mountain ranges or coastlines. The onshore wind map of the United States shows this pattern, with the best wind along a north-south corridor roughly at mid-continent (Figure 80 Meter Wind Resource Map). Offshore winds over the Great Lakes and the east and west coasts are stronger and steadier though they cover smaller areas. The technical potential for onshore wind is over 8000 GW of capacity (Lu, 2009; Black & Veatch, 2007) and offshore is 800 – 3000 GW (Lu, 2009; Schwartz, Heimiller, Haymes, & Musial, 2010). For comparison, the United States used electricity in 2009 at the rate of 450 GW averaged over the day-night and summer-winter peaks and valleys.

Barriers to Deployment
Renewable energy faces several barriers to its widespread deployment. Cost is one of the most serious, illustrated in Figure Production Cost of Electricity – 2020 Projection. Although the cost of renewables has declined significantly in recent years, most are still higher in cost than traditional fossil alternatives. Fossil energy technologies have a longer experience in streamlining manufacturing, incorporating new materials, taking advantage of economies of scale and understanding the underlying physical and chemical phenomena of the energy conversion process. As Figure Production Cost of Electricity – 2020 Projection shows, the lowest cost electricity is generated by natural gas and coal, with hydro and wind among the renewable challengers. Cost, however, is not an isolated metric; it must be compared with the alternatives. One of the uncertainties of the present business environment is the ultimate cost of carbon emissions. If governments put a price on carbon emission to compensate the social cost of global warming and the threat of climate change, the relative cost of renewables will become more appealing even if their absolute cost does not change. This policy uncertainty in the eventual cost of carbon-based power generation is a major factor in the future economic appeal of renewable energy.

A second barrier to widespread deployment of renewable energy is public opinion. In the consumer market, sales directly sample public opinion and the connection between deployment and public acceptance is immediate. Renewable energy is not a choice that individual consumers make. Instead, energy choices are made by government policy makers at city, state and federal levels, who balance concerns for the common good, for “fairness” to stakeholders, and for economic cost. Nevertheless, public acceptance is a major factor in balancing these concerns: a strongly favored or disfavored energy option will be reflected in government decisions through representatives elected by or responding to the public. Figure Acceptance of Different Sources of Energy shows the public acceptance of renewable and fossil electricity options. The range of acceptance goes from strongly positive for solar to strongly negative for nuclear. The disparity in the public acceptance and economic cost of these two energy alternatives is striking: solar is at once the most expensive alternative and the most acceptable to the public.
The importance of public opinion is illustrated by the Fukushima nuclear disaster of 2011. The earthquake and tsunami that ultimately caused meltdown of fuel in several reactors of the Fukushima complex and release of radiation in a populated area caused many of the public in many countries to question the safety of reactors and of the nuclear electricity enterprise generally. The response was rapid, with some countries registering public consensus for drastic action such as shutting down nuclear electricity when the licenses for the presently operating reactors expire. Although its ultimate resolution is uncertain, the sudden and serious impact of the Fukushima event on public opinion shows the key role that social acceptance plays in determining our energy trajectory.

Summary
Strong interest in renewable energy arose in the 1970s as a response to the shortage and high price of imported oil, which disrupted the orderly operation of the economies and societies of many developed countries. Today there are new motivations, including the realization that growing greenhouse gas emission accelerates global warming and threatens climate change, the growing dependence of many countries on foreign oil, and the economic drain of foreign oil payments that slow economic growth and job creation. There are three ultimate sources of all renewable and fossil energies: sunlight, the heat in the earth’s core and crust, and the gravitational pull of the moon and sun on the oceans. Renewable energies are relatively recently developed and typically operate at lower efficiencies than mature fossil technologies. Like early fossil technologies, however, renewables can be expected to improve their efficiency and lower their cost over time, promoting their economic competitiveness and widespread deployment.
The future deployment of renewable energies depends on many factors, including the availability of suitable land, the technological cost of conversion to electricity or other uses, the costs of competing energy technologies, and the future need for energy. Scenario analyses indicate that renewable energies are likely to be technically and economically capable of supplying the world’s electricity needs in 2050. In addition to cost, public acceptance is a key factor in the widespread deployment of renewable energy.
Attribution
Essentials of Environmental Science by Kamala Doršner is licensed under CC BY 4.0. Modified from the original by Matthew R. Fisher.
Candela Citations
- Authored by: George Crabtree. Located at: https://cnx.org/contents/JFkrFJcl@1.1:SaOi82uP@3/Renewable-Energy-Solar-Wind-Hy. License: Public Domain: No Known Copyright