Name: ______________________________________________________
1) You are unhappy with the logging company you hired to thin a stand of red pine. You carefully laid out the skid trails leaving bumper trees to avoid excess damage to the remaining trees. In the contract, it is stated that the logging company would pay a penalty (3 times the stumpage rate) for trees damaged beyond the agreed amount of five or more damaged trees per acre. You want to estimate the number of damaged trees per acre to see if they exceeded this amount. You take 27 samples, from which you compute the sample mean, and then construct a 95% confidence interval about the mean number of damaged trees per acre.
|
2 |
4 |
0 |
3 |
5 |
0 |
0 |
1 |
3 |
|
2 |
7 |
4 |
8 |
10 |
0 |
2 |
1 |
1 |
|
5 |
3 |
5 |
6 |
4 |
9 |
5 |
3 |
6 |
Enter these data in the first column of the Minitab worksheet and label it “Trees.” Now calculate the sample mean and sample standard deviation. Stat>Basic Statistics>Display Descriptive Statistics. Select the column with your data in the variable box.
a) sample mean ____________________________
sample standard deviation ___________________
Examine the normal probability plot for this data set. Remember, for a sample size less than n = 30, we must verify the assumption of normality if we do not know that the random variable is normally distributed. Go to GRAPH → PROBABILITY PLOT. Enter the column with your data in the “Graph variables” box and click OK.
b) Would you say that this distribution is normal? ___________________________
c) Calculate the 95% confidence interval by hand using `x ± ![]() and the t-table.
and the t-table.
95% CI for the mean number of damaged trees ____________________________________
Now find the 95% confidence interval for the mean using Minitab.
Go to STAT> Basic Statistics> 1-sample t…Enter data in “Samples in columns.” You do not have to enter the standard deviation but select OPTIONS and set the confidence level (make sure it is for 95%) and select “Alternative:not equal.”
d) 95% CI for the mean number of damaged trees __________________________________
e) Do you have enough statistical evidence to state that the logging company has exceeded the damage limit? Why?
________________________________________________________________________
________________________________________________________________________
________________________________________________________________________
________________________________________________________________________
2) The amount of sewage and industrial pollution dumped into a body of water affects the health of the water by reducing the amount of dissolved oxygen available for aquatic life. If the population mean dissolved oxygen drops below five parts per million (ppm), a level some scientists think is marginal for supplying enough dissolved oxygen for fish, some remedial action will be attempted. Given the expense of remediation, a decision to take action will be made only if there is sufficient evidence to support the claim that the mean dissolved oxygen has DECREASED below 5 ppm. Below are weekly readings from the same location in a river over a two-month time period.
5.2, 4.9, 5.1, 4.2, 4.7, 4.5, 5.0, 5.2, 4.8, 4.6, 4.8
The population standard deviation is unknown and we have a small sample (n≤30). You must verify the assumption of normality. Go to GRAPH→PROBABILITY PLOT. Examine the normal probability plot. Does the distribution look normal?
________________________________________________________________________
Use DESCRIPTIVE STATISTICS (Basic Statistics>Display Descriptive Statistics) to get the mean and sample standard deviation.
Now test the claim that the mean dissolved oxygen is less than 5ppm using α = 0.05
a) First, state the null and alternative hypotheses
H0:__________________________________ H1: __________________________________
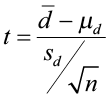
b) Compute the test statistic by hand 
c) Find the critical value from the t-table ________________________________________
d) Do you reject the null hypothesis or fail to reject the null hypothesis? ________________
______________________________________________________________________________
Now use Minitab to do the hypothesis test. Go to STAT > BASIC STAT > 1-SAMPLE t. Check PERFORM HYPOTHESIS TEST and enter the hypothesized mean (5.00). Click OPTIONS and enter the confidence level (1-α) and select alternative hypothesis (H1). Click OK. Check to see that the null and alternative hypotheses shown in the session window are correct.
e) What is the p-value for this test? ____________________________________________
f) Do you reject or fail to reject the null hypothesis? ______________________________
g) State your conclusion ______________________________________________________
____________________________________________________________________________
____________________________________________________________________________
____________________________________________________________________________
3) A forester believes that tent caterpillars are doing a significant amount of damage to the growth of the hardwood tree species in his stand. He has growth data from 21 plots before the infestation. Since then, he has re-measured those same plots and wants to know if there has been a significant reduction in the annual diameter growth.
|
Before |
After |
|
0.17 |
0.15 |
|
0.22 |
0.23 |
|
0.19 |
0.17 |
|
0.2 |
0.14 |
|
0.12 |
0.13 |
|
0.13 |
0.11 |
|
0.15 |
0.13 |
|
0.16 |
0.17 |
|
0.16 |
0.12 |
|
0.19 |
0.16 |
|
0.25 |
0.26 |
|
0.24 |
0.21 |
|
0.21 |
0.21 |
|
0.18 |
0.15 |
|
0.19 |
0.17 |
|
0.22 |
0.2 |
|
0.24 |
0.19 |
|
0.25 |
0.24 |
|
0.24 |
0.25 |
|
0.14 |
0.1 |
|
0.11 |
0.11 |
You need to compute the differences between the before values and the after values. To create a new variable (diff), type “diff” in the header of the column you want to use. Select CALC>CALCULATOR. In the “Expressions” box, type in the equation “Before-After.” In the box “Store results in variable” type “diff.” Click OK.
You now have a new data set of the differences with which you will complete your analyses. Compute basic descriptive statistics to get the sample mean ![]() and sample standard deviation
and sample standard deviation ![]() of the differences. Use these statistics to test the claim that there has been a reduction in annual diameter growth. You can answer this question by using either a hypothesis test or confidence interval.
of the differences. Use these statistics to test the claim that there has been a reduction in annual diameter growth. You can answer this question by using either a hypothesis test or confidence interval.
a) H0:____________________________________ H1: ____________________________________
 or
or 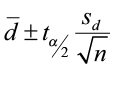
Do you reject or fail to reject the null hypothesis? ____________________________________
Now let Minitab do the work for you. Select STAT> Basic Statistics> Paired t… Select SAMPLES IN COLUMNS. Enter the before as the First sample and after data as the Second sample. Select OPTIONS to set the confidence level and alternative hypothesis. Make sure the Test mean is set to 0.0. Click OK.
b) Write the test statistic __________________ and p-value __________________
c) Write a complete conclusion that answers the question.
________________________________________________________________________
________________________________________________________________________
________________________________________________________________________
________________________________________________________________________
________________________________________________________________________
________________________________________________________________________
4) Alternative energy is an important topic these days and a researcher is studying a solar electric system. Each day at the same time he collected voltage readings from a meter connected to the system and the data are given below. Is there a significant difference in the mean voltage readings for the different types of days? First do an F-test to test for equal variances and then test the means using the appropriate 2-sample t-test based on the results from the F-test. Please state a complete conclusion for this problem. α = 0.05.
Sunny – 13.5, 15.8, 13.2, 13.9, 13.8, 14.0, 15.2, 12.1, 12.9, 14.9
Cloudy – 12.7, 12.5, 12.6, 12.7, 13.0, 13.0, 12.1, 12.2, 12.9, 12.7
F-Test
Write the null and alternative hypotheses to test the claim that the variances are not equal.
H0:____________________________________ H1: ____________________________________
Select STAT>BASIC STAT>2 Variances. In the Data box select “Samples in different columns” and enter Sunny in the First box and Cloudy in the Second box. Click OPTIONS and in Hypothesized Ratio box select Variance1/Variance2. Make sure the Alternative is set at “Not equal.” Click OK. Look at the p-value for the F-test at the bottom of the output.
Do you reject for fail to reject the null hypothesis? ____________________________________
Can you assume equal variances? ___________________________________________________
Now conduct a 2-sample t-test (you should have rejected the null hypothesis in the F-test and assumed unequal variances). STAT>BASIC STAT>2-Sample t…Select the button for “Samples in different columns” and put Sunny in the First box and Cloudy in the Second box. Click OPTIONS and set the confidence level and select the correct alternative hypothesis. Set the Test difference at 0.0. Click OK.
What is the p-value for this test? __________________________________________
Do you reject or fail to reject the null hypothesis? _____________________________
State your conclusion.
________________________________________________________________________
________________________________________________________________________
________________________________________________________________________
________________________________________________________________________
________________________________________________________________________
Candela Citations
- Natural Resources Biometrics. Authored by: Diane Kiernan. Located at: https://textbooks.opensuny.org/natural-resources-biometrics/. Project: Open SUNY Textbooks. License: CC BY-NC-SA: Attribution-NonCommercial-ShareAlike