Learning Objectives
- Calculate real GDP based on nominal GDP values
- Calculate the real growth rate in GDP
Now we’re in a position to answer the question that we posed previously: given nominal GDP for the U.S. economy from 1960-2010, how much did real GDP actually increase?
In order to see how much production has actually increased, we need to extract the effects of higher prices on nominal GDP, so that what we’re left with is real GDP, the increase in the quantity of goods and services produced. This can be easily done using a concept known as the GDP deflator. The GDP deflator is a price index measuring the average price of all goods and services included in the economy. We will explore price indices in detail and how they are computed when we learn more about inflation, but this definition will do for now. The data for the GDP deflator are given in Table 1 and shown graphically in Figure 1.
| Table 1. U.S. GDP Deflator, 1960-2010 | ||
| 1960 | 19.0 |
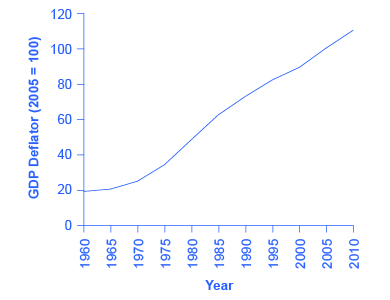
Figure 1. U.S. GDP Deflator, 1960–2010. Much like nominal GDP, the GDP deflator has risen exponentially from 1960 through 2010. (Source: BEA). |
| 1965 | 20.3 | |
| 1970 | 24.8 | |
| 1975 | 34.1 | |
| 1980 | 48.3 | |
| 1985 | 62.3 | |
| 1990 | 72.7 | |
| 1995 | 81.7 | |
| 2000 | 89.0 | |
| 2005 | 100.0 | |
| 2010 | 110.0 | |
| Source: www.bea.gov, National Accounts | ||
Figure 1 shows that the price level, as measured by the GDP deflator, has risen dramatically since 1960. Using the simple growth rate formula that we explained on the last page, we see that the price level in 2010 was almost six times higher than in 1960 (the deflator for 2010 was 110 versus a level of 19 in 1960). Clearly, much of the apparent growth in nominal GDP was due to inflation, not an actual change in the quantity of goods and services produced, in other words, not in real GDP. Recall that nominal GDP can rise for two reasons: an increase in output, and/or an increase in prices. What is needed is to extract the increase in prices from nominal GDP so as to measure only changes in output. After all, the dollars used to measure nominal GDP in 1960 are worth more than the inflated dollars of 1990—and the price index tells exactly how much more. This adjustment is easy to do if you use the Nominal-to-Real formula that we explained previously:
[latex]\text{Nominal Value of Output}=\text{Price}\times\text{Quantity of Output}[/latex]
Taking the GDP form of this equation:
[latex]\text{Nominal GDP}=\text{GDP Deflator}\times\text{Real GDP}[/latex]
Divide both sides by the GDP Deflator:
[latex]\displaystyle\text{Real GDP}=\frac{\text{Nominal GDP}}{\text{GDP Deflator}}[/latex]
For reasons that will be explained in more detail below, mathematically, a price index (like the GDP Deflator) is a two-digit decimal number like 1.00 or 0.85 or 1.25. Because some people have trouble working with decimals, when the price index is published, it has traditionally been multiplied by 100 to get integer numbers like 100, 85, or 125. What this means is that when we “deflate” nominal figures to get real figures (by dividing the nominal by the price index), we also need to remember to divide the published price index by 100 to make the math work. So the formula becomes:
[latex]\displaystyle\text{Real GDP}=\frac{\text{Nominal GDP}}{\frac{\text{GDP Deflator}}{100}}[/latex]
Computing Real GDP
Let’s practice finding real GDP by looking at the actual data on nominal GDP and the GDP deflator.
| Table 2. U.S. Nominal GDP and the GDP Deflator | ||
|---|---|---|
| Year | Nominal GDP (billions of dollars) | GDP Deflator (2005 = 100) |
| 1960 | 543.3 | 19.0 |
| 1965 | 743.7 | 20.3 |
| 1970 | 1,075.9 | 24.8 |
| 1975 | 1,688.9 | 34.1 |
| 1980 | 2,862.5 | 48.3 |
| 1985 | 4,346.7 | 62.3 |
| 1990 | 5,979.6 | 72.7 |
| 1995 | 7,664.0 | 81.7 |
| 2000 | 10,289.7 | 89.0 |
| 2005 | 13,095.4 | 100.0 |
| 2010 | 14,958.3 | 110.0 |
| Source: www.bea.gov | ||
Step 1. Look at Table 2 to see that, in 1960, nominal GDP was $543.3 billion and the price index (GDP deflator) was 19.0.
Step 2. To calculate the real GDP in 1960, use the formula:
[latex]\begin{array}{l}\text{Real GDP}=\frac{\text{Nominal GDP}}{\frac{\text{Price Index}}{100}}\\\text{Real GDP}=\frac{543.3\text{ billion}}{\frac{19}{100}}=\$2,859.5\text{ billion}\end{array}[/latex]
We’ll do this in two parts to make it clear. First adjust the price index: 19 divided by [latex]100=0.19[/latex]. Then divide into nominal GDP:
[latex]\frac{\$543.3\text{ billion}}{0.19}=\$2,859.5\text{ billion}[/latex].
Step 3. Use the same formula to calculate the real GDP in 1965.
[latex]\begin{array}{l}\text{Real GDP}=\frac{\text{Nominal GDP}}{\frac{\text{Price Index}}{100}}\\\text{Real GDP}=\frac{743.7\text{ billion}}{\frac{20.3}{100}}=\$3,663.5\text{ billion}\end{array}[/latex]
Step 4. Continue using this formula to calculate all of the real GDP values from 1960 through 2010. The calculations and the results are shown in Table 3.
| Table 3. Converting Nominal to Real GDP | ||||
|---|---|---|---|---|
| Year | Nominal GDP (billions of dollars) | GDP Deflator (2005 = 100) | Calculations | Real GDP (billions of 2005 dollars) |
| 1960 | 543.3 | 19.0 | [latex]\displaystyle\frac{543.3}{(\frac{19.0}{100})}[/latex] |
Show Answer
|
| 1965 | 743.7 | 20.3 | 743.7 / (20.3/100) [latex]\displaystyle\frac{743.7}{(\frac{20.3}{100})}[/latex] |
Show Answer
|
| 1970 | 1075.9 | 24.8 | 1,075.9 / (24.8/100) [latex]\displaystyle\frac{1,075.9}{(\frac{24.8}{100})}[/latex] |
Show Answer
|
| 1975 | 1688.9 | 34.1 | 1,688.9 / (34.1/100) [latex]\displaystyle\frac{1,688.9}{(\frac{34.1}{100})}[/latex] |
Show Answer
|
| 1980 | 2862.5 | 48.3 | 2,862.5 / (48.3/100) [latex]\displaystyle\frac{2,862.5}{(\frac{48.3}{100})}[/latex] |
Show Answer
|
| 1985 | 4346.7 | 62.3 | 4,346.7 / (62.3/100) [latex]\displaystyle\frac{4,346.7}{(\frac{62.3}{100})}[/latex] |
Show Answer
|
| 1990 | 5979.6 | 72.7 | 5,979.6 / (72.7/100) [latex]\displaystyle\frac{5,979.6}{(\frac{72.7}{100})}[/latex] |
Show Answer
|
| 1995 | 7664.0 | 82.0 | 7,664 / (82.0/100) [latex]\displaystyle\frac{7,664.0}{(\frac{82.0}{100})}[/latex] |
Show Answer
|
| 2000 | 10289.7 | 89.0 | 10,289.7 / (89.0/100) [latex]\displaystyle\frac{10,289.7}{(\frac{89.0}{100})}[/latex] |
Show Answer
|
| 2005 | 13095.4 | 100.0 | 13,095.4 / (100.0/100) [latex]\displaystyle\frac{13,095.4}{(\frac{100.0}{100})}[/latex] |
Show Answer
|
| 2010 | 14958.3 | 110.0 | 14,958.3 / (110.0/100) [latex]\displaystyle\frac{14,958.3}{(\frac{110.0}{100})}[/latex] |
Show Answer
|
| Source: Bureau of Economic Analysis, www.bea.gov | ||||
There are a couple things to notice here. Whenever you compute a real statistic, one year (or period) plays a special role. It is called the base year (or base period). The base year is the year whose prices are used to compute the real statistic (as we showed on the last page). When we calculate real GDP, for example, we take the quantities of goods and services produced in each year (for example, 1960 or 1973) and multiply them by their prices in the base year (in this case, 2005), so we get a measure of GDP that uses prices that do not change from year to year. That is why real GDP is labeled “Constant Dollars” or “2005 Dollars,” which means that real GDP is constructed using prices that existed in 2005. The formula used is:
[latex]\displaystyle\text{GDP deflator}=\frac{\text{Nominal GDP}}{\text{Real GDP}}\times{100}[/latex]
Rearranging the formula and using the data from 2005:
[latex]\begin{array}{l}\text{Real GDP}=\frac{\text{Nominal GDP}}{\frac{\text{Price Index}}{100}}\\\text{Real GDP}=\frac{13,095.4\text{ billion}}{\frac{100}{100}}=\$13,095.4\text{ billion}\end{array}[/latex]
Comparing real GDP and nominal GDP for 2005, you see they are the same. This is no accident. It is because 2005 has been chosen as the “base year” in this example. Since the price index in the base year always has a value of 100 (by definition), nominal and real GDP are always the same in the base year. Look at the data for 2010.
[latex]\begin{array}{l}\text{Real GDP}=\frac{\text{Nominal GDP}}{\frac{\text{Price Index}}{100}}\\\text{Real GDP}=\frac{14,958.3\text{ billion}}{\frac{100}{100}}=\$13,598.5\text{ billion}\end{array}[/latex]
Use this data to make another observation: As long as inflation is positive, meaning prices increase on average from year to year, real GDP should be less than nominal GDP in any year after the base year. The reason for this should be clear: The value of nominal GDP is “inflated” by inflation. Similarly, as long as inflation is positive, real GDP should be greater than nominal GDP in any year before the base year.
Try It
Figure 2 shows the U.S. nominal and real GDP since 1960. Because 2005 is the base year, the nominal and real values are exactly the same in that year. However, over time, the rise in nominal GDP looks much larger than the rise in real GDP (that is, the nominal GDP line rises more steeply than the real GDP line), because the rise in nominal GDP is exaggerated by the presence of inflation, especially in the 1970s.
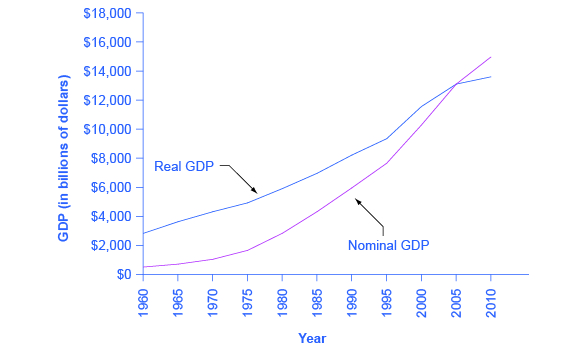
Figure 2. U.S. Nominal and Real GDP, 1960–2012. The red line measures U.S. GDP in nominal dollars. The black line measures U.S. GDP in real dollars, where all dollar values have been converted to 2005 dollars. Since real GDP is expressed in 2005 dollars, the two lines cross in 2005. However, real GDP will appear higher than nominal GDP in the years before 2005, because dollars were worth less in 2005 than in previous years. Conversely, real GDP will appear lower in the years after 2005, because dollars were worth more in 2005 than in later years.
Let’s return to the question posed originally: How much did GDP increase in real terms? What was the rate of growth of real GDP from 1960 to 2010? To find the real growth rate, we apply the formula for percentage change:
In other words, the U.S. economy has increased real production of goods and services by nearly a factor of four (i.e. 376%) since 1960. Of course, that understates the material improvement since it fails to capture improvements in the quality of products and the invention of new products.
For short periods of time, there is a quicker way to answer this question approximately, using another math trick. Remember that nominal GDP increases for two reasons, first, because prices increase and second because real GDP increases. In other words the percentage increase in nominal GDP is (approximately) equal to the percentage increase in prices plus the percentage increase in real GDP.
Expressing this as an equation,
[latex]\%{\text{ change in nominal GDP}}=\%{\text{ change in prices}}+\%{\text{ change in real GDP}}[/latex]
Subtracting % change in prices from both sides gives:
[latex]\%{\text{ change in nominal GDP}}-\%{\text{ change in prices}}=\%{\text{ change in real GDP}}[/latex]
Therefore, the growth rate (percent change) of real GDP equals the growth rate in nominal GDP (% change in value) minus the growth rate in prices (% change in GDP Deflator).
Two Ways to Calculate Growth Rates
Let’s look at the bottom numbers from the following table:
| Year | Nominal GDP | GDP Deflator | Real GDP |
| 2005 | $13095.4 | 100 | $13095.4 |
| 2010 | $14958.3 | 110 | $13598.5 |
Method 1: Using the Simple Growth Rate formula
(Real GDP in 2010 – Real GDP in 2005) / Real GDP in 2005 = Growth of Real GDP
Plugging in the numbers gives
($13,598.5- $13,095.4) / $13,095.5 = 4%
Method 2: Using the Math Trick
Growth of Nominal GDP – Growth of GDP Deflator = Growth of Real GDP
Plugging in the numbers and using the Simple Growth Rate formula gives
[latex]\frac{($14,958.3-$13,095.4)}{$13095.5}-(\frac{(110-100)}{100})=14.2\%-10\%=4.2\%[/latex]
Note that Method 2 is only a quick approximation to Method 1.
Try It
Try It
These questions allow you to get as much practice as you need, as you can click the link at the top of the first question (“Try another version of these questions”) to get a new set of questions. Practice until you feel comfortable doing the questions.
Candela Citations
- Adjusting Nominal Values to Real Values. Authored by: OpenStax College. Located at: https://cnx.org/contents/QGHIMgmO@11.12:FDAWX8lT@7/Adjusting-Nominal-Values-to-Re. License: CC BY: Attribution. License Terms: Download for free at http://cnx.org/contents/4061c832-098e-4b3c-a1d9-7eb593a2cb31@11.11