Appendix
Important Proofs and Derivations
Product Rule
[latex]{\mathrm{log}}_{a}xy={\mathrm{log}}_{a}x+{\mathrm{log}}_{a}y[/latex]
Proof:
Let[latex]\,m={\mathrm{log}}_{a}x\,[/latex]and[latex]\,n={\mathrm{log}}_{a}y.[/latex]
Write in exponent form.
[latex]x={a}^{m}\,[/latex]and[latex]\,y={a}^{n}.[/latex]
Multiply.
[latex]xy={a}^{m}{a}^{n}={a}^{m+n}[/latex]
[latex]\begin{array}{ccc}\hfill {a}^{m+n}& =& xy\hfill \\ \hfill {\mathrm{log}}_{a}\left(xy\right)& =& m+n\hfill \\ & =& {\mathrm{log}}_{a}x+{\mathrm{log}}_{b}y\hfill \end{array}[/latex]
Change of Base Rule
[latex]\begin{array}{l}\hfill \\ {\mathrm{log}}_{a}b=\frac{{\mathrm{log}}_{c}b}{{\mathrm{log}}_{c}a}\hfill \\ {\mathrm{log}}_{a}b=\frac{1}{{\mathrm{log}}_{b}a}\hfill \end{array}[/latex]
where[latex]\,x\,[/latex]and[latex]\,y\,[/latex]are positive, and[latex]\,a>0,a\ne 1.[/latex]
Proof:
Let[latex]\,x={\mathrm{log}}_{a}b.[/latex]
Write in exponent form.
[latex]{a}^{x}=b[/latex]
Take the[latex]\,{\mathrm{log}}_{c}\,[/latex]of both sides.
[latex]\begin{array}{ccc}\hfill {\mathrm{log}}_{c}{a}^{x}& =& {\mathrm{log}}_{c}b\hfill \\ \hfill x{\mathrm{log}}_{c}a& =& {\mathrm{log}}_{c}b\hfill \\ \hfill x& =& \frac{{\mathrm{log}}_{c}b}{{\mathrm{log}}_{c}a}\hfill \\ \hfill {\mathrm{log}}_{a}b& =& \frac{{\mathrm{log}}_{c}b}{{\mathrm{log}}_{a}b}\hfill \end{array}[/latex]
When[latex]\,c=b,[/latex]
[latex]{\mathrm{log}}_{a}b=\frac{{\mathrm{log}}_{b}b}{{\mathrm{log}}_{b}a}=\frac{1}{{\mathrm{log}}_{b}a}[/latex]
Heron’s Formula
[latex]A=\sqrt{s\left(s-a\right)\left(s-b\right)\left(s-c\right)}[/latex]
where[latex]\,s=\frac{a+b+c}{2}[/latex]
Proof:
Let[latex]\,a,[/latex][latex]b,[/latex]and[latex]\,c\,[/latex]be the sides of a triangle, and[latex]\,h\,[/latex]be the height.
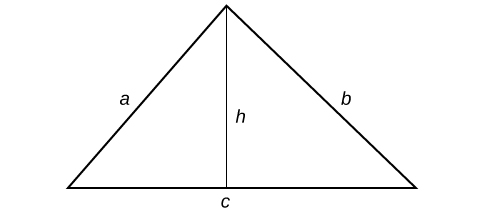
Figure 1.
So[latex]\,s=\frac{a+b+c}{2}[/latex].
We can further name the parts of the base in each triangle established by the height such that[latex]\,p+q=c.[/latex]
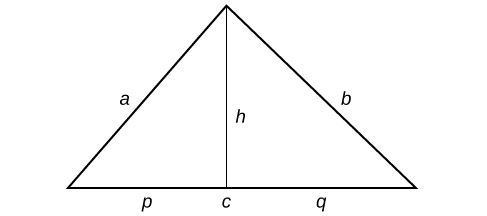
Figure 2.
Using the Pythagorean Theorem,[latex]\,{h}^{2}+{p}^{2}={a}^{2}\,[/latex]and[latex]\,{h}^{2}+{q}^{2}={b}^{2}.[/latex]
Since[latex]\,q=c-p,[/latex]then[latex]\,{q}^{2}={\left(c-p\right)}^{2}.\,[/latex]Expanding, we find that[latex]\,{q}^{2}={c}^{2}-2cp+{p}^{2}.[/latex]
We can then add[latex]\,{h}^{2}\,[/latex]to each side of the equation to get[latex]\,{h}^{2}+{q}^{2}={h}^{2}+{c}^{2}-2cp+{p}^{2}.[/latex]
Substitute this result into the equation[latex]\,{h}^{2}+{q}^{2}={b}^{2}\,[/latex]yields[latex]\,{b}^{2}={h}^{2}+{c}^{2}-2cp+{p}^{2}.[/latex]
Then replacing[latex]\,{h}^{2}+{p}^{2}\,[/latex]with[latex]\,{a}^{2}\,[/latex]gives[latex]\,{b}^{2}={a}^{2}-2cp+{c}^{2}.[/latex]
Solve for[latex]\,p\,[/latex]to get
[latex]p=\frac{{a}^{2}+{b}^{2}-{c}^{2}}{2c}[/latex]
Since[latex]\,{h}^{2}={a}^{2}-{p}^{2},[/latex]we get an expression in terms of[latex]\,a,[/latex][latex]b,[/latex]and [latex]\,c.[/latex]
[latex]\begin{array}{ccc}\hfill {h}^{2}& =& {a}^{2}-{p}^{2}\hfill \\ & =& \left(a+p\right)\left(a-p\right)\hfill \\ & =& \left[a+\frac{\left({a}^{2}+{c}^{2}-{b}^{2}\right)}{2c}\right]\left[a-\frac{\left({a}^{2}+{c}^{2}-{b}^{2}\right)}{2c}\right]\hfill \\ & =& \frac{\left(2ac+{a}^{2}+{c}^{2}-{b}^{2}\right)\left(2ac-{a}^{2}-{c}^{2}+{b}^{2}\right)}{4{c}^{2}}\hfill \\ & =& \frac{\left({\left(a+c\right)}^{2}-{b}^{2}\right)\left({b}^{2}-{\left(a-c\right)}^{2}\right)}{4{c}^{2}}\hfill \\ & =& \frac{\left(a+b+c\right)\left(a+c-b\right)\left(b+a-c\right)\left(b-a+c\right)}{4{c}^{2}}\hfill \\ & =& \frac{\left(a+b+c\right)\left(-a+b+c\right)\left(a-b+c\right)\left(a+b-c\right)}{4{c}^{2}}\hfill \\ & =& \frac{2s\cdot \left(2s-a\right)\cdot \left(2s-b\right)\left(2s-c\right)}{4{c}^{2}}\hfill \end{array}[/latex]
Therefore,
[latex]\begin{array}{ccc}\hfill {h}^{2}& =& \frac{4s\left(s-a\right)\left(s-b\right)\left(s-c\right)}{{c}^{2}}\hfill \\ \hfill h& =& \frac{2\sqrt{s\left(s-a\right)\left(s-b\right)\left(s-c\right)}}{c}\hfill \end{array}[/latex]
And since[latex]\,A=\frac{1}{2}ch,[/latex]then
[latex]\begin{array}{ccc}\hfill A& =& \frac{1}{2}c\frac{2\sqrt{s\left(s-a\right)\left(s-b\right)\left(s-c\right)}}{c}\hfill \\ & =& \sqrt{s\left(s-a\right)\left(s-b\right)\left(s-c\right)}\hfill \end{array}[/latex]
Properties of the Dot Product
[latex]u·v=v·u[/latex]
Proof:
[latex]\begin{array}{cc}\hfill u·v& =〈{u}_{1},{u}_{2},...{u}_{n}〉·〈{v}_{1},{v}_{2},...{v}_{n}〉\hfill \\ & ={u}_{1}{v}_{1}+{u}_{2}{v}_{2}+...+{u}_{n}{v}_{n}\hfill \\ & ={v}_{1}{u}_{1}+{v}_{2}{u}_{2}+...+{v}_{n}{v}_{n}\hfill \\ & =〈{v}_{1},{v}_{2},...{v}_{n}〉·〈{u}_{1},{u}_{2},...{u}_{n}〉\hfill \\ & =v·u\hfill \end{array}[/latex]
[latex]u·\left(v+w\right)=u·v+u·w[/latex]
Proof:
[latex]\begin{array}{cc}\hfill u·\left(v+w\right)& =〈{u}_{1},{u}_{2},...{u}_{n}〉·\left(〈{v}_{1},{v}_{2},...{v}_{n}〉+〈{w}_{1},{w}_{2},...{w}_{n}〉\right)\hfill \\ & =〈{u}_{1},{u}_{2},...{u}_{n}〉·〈{v}_{1}+{w}_{1},{v}_{2}+{w}_{2},...{v}_{n}+{w}_{n}〉\hfill \\ & =〈{u}_{1}\left({v}_{1}+{w}_{1}\right),{u}_{2}\left({v}_{2}+{w}_{2}\right),...{u}_{n}\left({v}_{n}+{w}_{n}\right)〉\hfill \\ & =〈{u}_{1}{v}_{1}+{u}_{1}{w}_{1},{u}_{2}{v}_{2}+{u}_{2}{w}_{2},...{u}_{n}{v}_{n}+{u}_{n}{w}_{n}〉\hfill \\ & =〈{u}_{1}{v}_{1},{u}_{2}{v}_{2},...,{u}_{n}{v}_{n}〉+〈{u}_{1}{w}_{1},{u}_{2}{w}_{2},...,{u}_{n}{w}_{n}〉\hfill \\ & =〈{u}_{1},{u}_{2},...{u}_{n}〉·〈{v}_{1},{v}_{2},...{v}_{n}〉+〈{u}_{1},{u}_{2},...{u}_{n}〉·〈{w}_{1},{w}_{2},...{w}_{n}〉\hfill \\ & =u·v+u·w\hfill \end{array}[/latex]
[latex]u·u={|u|}^{2}[/latex]
Proof:
[latex]\begin{array}{cc}\hfill u·u& =〈{u}_{1},{u}_{2},...{u}_{n}〉·〈{u}_{1},{u}_{2},...{u}_{n}〉\hfill \\ & ={u}_{1}{u}_{1}+{u}_{2}{u}_{2}+...+{u}_{n}{u}_{n}\hfill \\ & ={u}_{1}{}^{2}+{u}_{2}{}^{2}+...+{u}_{n}{}^{2}\hfill \\ & =|〈{u}_{1},{u}_{2},...{u}_{n}〉{|}^{2}\hfill \\ & =v·u\hfill \end{array}[/latex]
Standard Form of the Ellipse centered at the Origin
[latex]1=\frac{{x}^{2}}{{a}^{2}}+\frac{{y}^{2}}{{b}^{2}}[/latex]
Derivation
An ellipse consists of all the points for which the sum of distances from two foci is constant:
[latex]\sqrt{{\left(x-\left(-c\right)\right)}^{2}+{\left(y-0\right)}^{2}}+\sqrt{{\left(x-c\right)}^{2}+{\left(y-0\right)}^{2}}=\text{constant}[/latex]
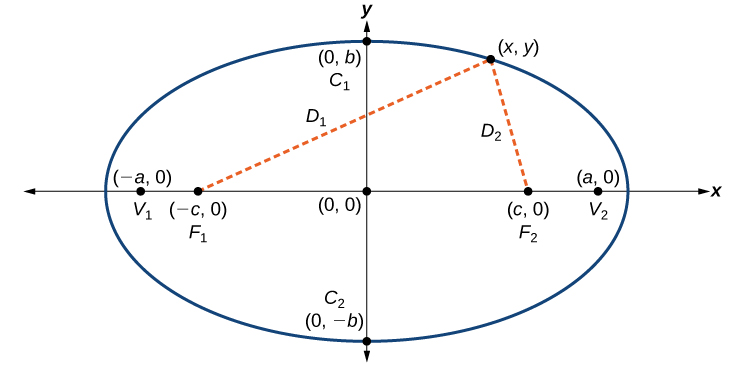
Figure 3.
Consider a vertex.
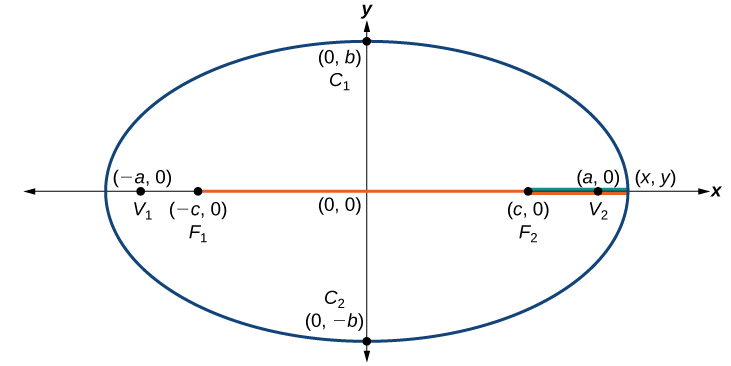
Figure 4.
Then,[latex]\,\sqrt{{\left(x-\left(-c\right)\right)}^{2}+{\left(y-0\right)}^{2}}+\sqrt{{\left(x-c\right)}^{2}+{\left(y-0\right)}^{2}}=2a[/latex]
Consider a covertex.
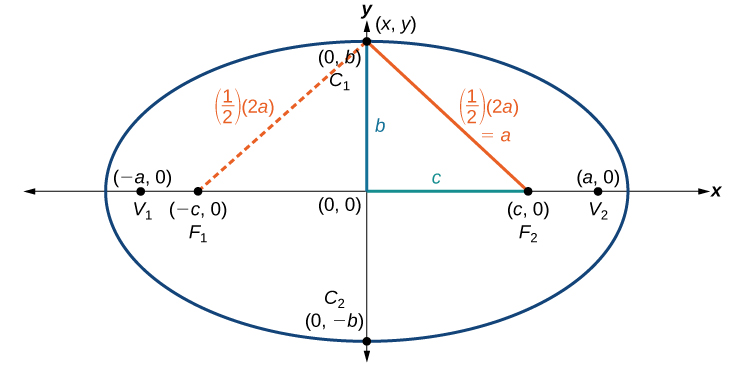
Figure 5.
Then[latex]\,{b}^{2}+{c}^{2}={a}^{2}.[/latex]
[latex]\begin{array}{ccc}\hfill \sqrt{{\left(x-\left(-c\right)\right)}^{2}+{\left(y-0\right)}^{2}}+\sqrt{{\left(x-c\right)}^{2}+{\left(y-0\right)}^{2}}& =& 2a\hfill \\ \hfill \sqrt{{\left(x+c\right)}^{2}+{y}^{2}}& =& 2a-\sqrt{{\left(x-c\right)}^{2}+{y}^{2}}\hfill \\ \hfill {\left(x+c\right)}^{2}+{y}^{2}& =& {\left(2a-\sqrt{{\left(x-c\right)}^{2}+{y}^{2}}\right)}^{2}\hfill \\ \hfill {x}^{2}+2cx+{c}^{2}+{y}^{2}& =& 4{a}^{2}-4a\sqrt{{\left(x-c\right)}^{2}+{y}^{2}}+{\left(x-c\right)}^{2}+{y}^{2}\hfill \\ \hfill {x}^{2}+2cx+{c}^{2}+{y}^{2}& =& 4{a}^{2}-4a\sqrt{{\left(x-c\right)}^{2}+{y}^{2}}+{x}^{2}-2cx+{y}^{2}\hfill \\ \hfill 2cx& =& 4{a}^{2}-4a\sqrt{{\left(x-c\right)}^{2}+{y}^{2}}-2cx\hfill \\ \hfill 4cx-4{a}^{2}& =& 4a\sqrt{{\left(x-c\right)}^{2}+{y}^{2}}\hfill \\ \hfill -\frac{1}{4a}\left(4cx-4{a}^{2}\right)& =& \sqrt{{\left(x-c\right)}^{2}+{y}^{2}}\hfill \\ \hfill a-\frac{c}{a}x& =& \sqrt{{\left(x-c\right)}^{2}+{y}^{2}}\hfill \\ \hfill {a}^{2}-2xc+\frac{{c}^{2}}{{a}^{2}}{x}^{2}& =& {\left(x-c\right)}^{2}+{y}^{2}\hfill \\ \hfill {a}^{2}-2xc+\frac{{c}^{2}}{{a}^{2}}{x}^{2}& =& {x}^{2}-2xc+{c}^{2}+{y}^{2}\hfill \\ \hfill {a}^{2}+\frac{{c}^{2}}{{a}^{2}}{x}^{2}& =& {x}^{2}+{c}^{2}+{y}^{2}\hfill \\ \hfill {a}^{2}+\frac{{c}^{2}}{{a}^{2}}{x}^{2}& =& {x}^{2}+{c}^{2}+{y}^{2}\hfill \\ \hfill {a}^{2}-{c}^{2}& =& {x}^{2}-\frac{{c}^{2}}{{a}^{2}}{x}^{2}+{y}^{2}\hfill \\ \hfill {a}^{2}-{c}^{2}& =& {x}^{2}\left(1-\frac{{c}^{2}}{{a}^{2}}\right)+{y}^{2}\hfill \end{array}[/latex]
Let[latex]\,1=\frac{{a}^{2}}{{a}^{2}}.[/latex]
Because[latex]\,{b}^{2}+{c}^{2}={a}^{2},[/latex]then[latex]\,{b}^{2}={a}^{2}-{c}^{2}.[/latex]
Standard Form of the Hyperbola
[latex]1=\frac{{x}^{2}}{{a}^{2}}-\frac{{y}^{2}}{{b}^{2}}[/latex]
Derivation
A hyperbola is the set of all points in a plane such that the absolute value of the difference of the distances between two fixed points is constant.
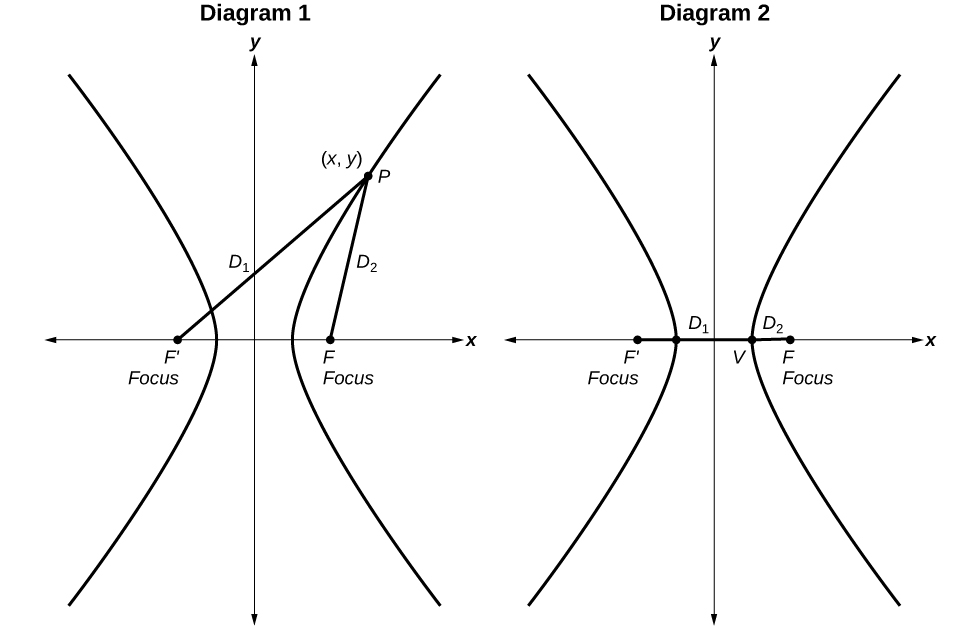
Figure 6.
Diagram 1: The difference of the distances from Point P to the foci is constant:
[latex]\sqrt{{\left(x-\left(-c\right)\right)}^{2}+{\left(y-0\right)}^{2}}-\sqrt{{\left(x-c\right)}^{2}+{\left(y-0\right)}^{2}}=\text{constant}[/latex]
Diagram 2: When the point is a vertex, the difference is[latex]\,2a.[/latex]
[latex]\sqrt{{\left(x-\left(-c\right)\right)}^{2}+{\left(y-0\right)}^{2}}-\sqrt{{\left(x-c\right)}^{2}+{\left(y-0\right)}^{2}}=2a[/latex]
[latex]\begin{array}{ccc}\hfill \sqrt{{\left(x-\left(-c\right)\right)}^{2}+{\left(y-0\right)}^{2}}-\sqrt{{\left(x-c\right)}^{2}+{\left(y-0\right)}^{2}}& =& 2a\hfill \\ \hfill \sqrt{{\left(x+c\right)}^{2}+{y}^{2}}-\sqrt{{\left(x-c\right)}^{2}+{y}^{2}}& =& 2a\hfill \\ \hfill \sqrt{{\left(x+c\right)}^{2}+{y}^{2}}& =& 2a+\sqrt{{\left(x-c\right)}^{2}+{y}^{2}}\hfill \\ \hfill {\left(x+c\right)}^{2}+{y}^{2}& =& \left(2a+\sqrt{{\left(x-c\right)}^{2}+{y}^{2}}\right)\hfill \\ \hfill {x}^{2}+2cx+{c}^{2}+{y}^{2}& =& 4{a}^{2}+4a\sqrt{{\left(x-c\right)}^{2}}+{y}^{2}\hfill \\ \hfill {x}^{2}+2cx+{c}^{2}+{y}^{2}& =& 4{a}^{2}+4a\sqrt{{\left(x-c\right)}^{2}+{y}^{2}}+{x}^{2}-2cx+{y}^{2}\hfill \\ \hfill 2cx& =& 4{a}^{2}+4a\sqrt{{\left(x-c\right)}^{2}+{y}^{2}}-2cx\hfill \\ \hfill 4cx-4{a}^{2}& =& 4a\sqrt{{\left(x-c\right)}^{2}+{y}^{2}}\hfill \\ \hfill cx-{a}^{2}& =& a\sqrt{{\left(x-c\right)}^{2}+{y}^{2}}\hfill \\ \hfill {\left(cx-{a}^{2}\right)}^{2}& =& {a}^{2}\left({\left(x-c\right)}^{2}+{y}^{2}\right)\hfill \\ \hfill {c}^{2}{x}^{2}-2{a}^{2}{c}^{2}{x}^{2}+{a}^{4}& =& {a}^{2}{x}^{2}-2{a}^{2}{c}^{2}{x}^{2}+{a}^{2}{c}^{2}+{a}^{2}{y}^{2}\hfill \\ \hfill {c}^{2}{x}^{2}+{a}^{4}& =& {a}^{2}{x}^{2}+{a}^{2}{c}^{2}+{a}^{2}{y}^{2}\hfill \\ \hfill {a}^{4}-{a}^{2}{c}^{2}& =& {a}^{2}{x}^{2}-{c}^{2}{x}^{2}+{a}^{2}{y}^{2}\hfill \\ \hfill {a}^{2}\left({a}^{2}-{c}^{2}\right)& =& \left({a}^{2}-{c}^{2}\right){x}^{2}+{a}^{2}{y}^{2}\hfill \\ \hfill {a}^{2}\left({a}^{2}-{c}^{2}\right)& =& \left({c}^{2}-{a}^{2}\right){x}^{2}-{a}^{2}{y}^{2}\hfill \end{array}[/latex]
Define[latex]\,b\,[/latex]as a positive number such that[latex]\,{b}^{2}={c}^{2}-{a}^{2}.[/latex]
Trigonometric Identities
| Pythagorean Identity | [latex]\begin{array}{l}{\mathrm{cos}}^{2}t+{\mathrm{sin}}^{2}t=1\\ 1+{\mathrm{tan}}^{2}t={\mathrm{sec}}^{2}t\\ 1+{\mathrm{cot}}^{2}t={\mathrm{csc}}^{2}t\end{array}[/latex] |
| Even-Odd Identities | [latex]\begin{array}{l}\mathrm{cos}\left(-t\right)=cos\,t\hfill \\ \mathrm{sec}\left(-t\right)=\mathrm{sec}\,t\hfill \\ \mathrm{sin}\left(-t\right)=-\mathrm{sin}\,t\hfill \\ \mathrm{tan}\left(-t\right)=-\mathrm{tan}\,t\hfill \\ \mathrm{csc}\left(-t\right)=-\mathrm{csc}\,t\hfill \\ \mathrm{cot}\left(-t\right)=-\mathrm{cot}\,t\hfill \end{array}[/latex] |
| Cofunction Identities | [latex]\begin{array}{l}\hfill \\ \mathrm{cos}\,t=\mathrm{sin}\left(\frac{\pi }{2}-t\right)\hfill \\ \mathrm{sin}\,t=\mathrm{cos}\left(\frac{\pi }{2}-t\right)\hfill \\ \mathrm{tan}\,t=\mathrm{cot}\left(\frac{\pi }{2}-t\right)\hfill \\ \mathrm{cot}\,t=\mathrm{tan}\left(\frac{\pi }{2}-t\right)\hfill \\ \mathrm{sec}\,t=\mathrm{csc}\left(\frac{\pi }{2}-t\right)\hfill \\ \mathrm{csc}\,t=\mathrm{sec}\left(\frac{\pi }{2}-t\right)\hfill \end{array}[/latex] |
| Fundamental Identities | [latex]\begin{array}{l}\mathrm{tan}\,t=\frac{\mathrm{sin}\,t}{\mathrm{cos}\,t}\hfill \\ \mathrm{sec}\,t=\frac{1}{\mathrm{cos}\,t}\hfill \\ \mathrm{csc}\,t=\frac{1}{\mathrm{sin}\,t}\hfill \\ cot\,t=\frac{1}{\text{tan}\,t}=\frac{\text{cos}\,t}{\text{sin}\,t}\hfill \end{array}[/latex] |
| Sum and Difference Identities | [latex]\begin{array}{l}\mathrm{cos}\left(\alpha +\beta \right)=\mathrm{cos}\,\alpha \,\mathrm{cos}\,\beta -\mathrm{sin}\,\alpha \,\mathrm{sin}\,\beta \hfill \\ \mathrm{cos}\left(\alpha -\beta \right)=\mathrm{cos}\,\alpha \,\mathrm{cos}\,\beta +\mathrm{sin}\,\alpha \,\mathrm{sin}\,\beta \hfill \\ \mathrm{sin}\left(\alpha +\beta \right)=\mathrm{sin}\,\alpha \,\mathrm{cos}\,\beta +\mathrm{cos}\,\alpha \,\mathrm{sin}\,\beta \hfill \\ \mathrm{sin}\left(\alpha -\beta \right)=\mathrm{sin}\,\alpha \,\mathrm{cos}\,\beta -\mathrm{cos}\,\alpha \,\mathrm{sin}\,\beta \hfill \\ \mathrm{tan}\left(\alpha +\beta \right)=\frac{\mathrm{tan}\,\alpha +\mathrm{tan}\,\beta }{1-\mathrm{tan}\,\alpha \,\mathrm{tan}\,\beta }\hfill \\ \mathrm{tan}\left(\alpha -\beta \right)=\frac{\mathrm{tan}\,\alpha -\mathrm{tan}\,\beta }{1+\mathrm{tan}\,\alpha \,\mathrm{tan}\,\beta }\hfill \end{array}[/latex] |
| Double-Angle Formulas | [latex]\begin{array}{l}\mathrm{sin}\left(2\theta \right)=2\mathrm{sin}\,\theta \,\mathrm{cos}\,\theta \hfill \\ \mathrm{cos}\left(2\theta \right)={\mathrm{cos}}^{2}\theta -{\mathrm{sin}}^{2}\theta \hfill \\ \mathrm{cos}\left(2\theta \right)=1-2{\mathrm{sin}}^{2}\theta \hfill \\ \mathrm{cos}\left(2\theta \right)=2{\mathrm{cos}}^{2}\theta -1\hfill \\ \mathrm{tan}\left(2\theta \right)=\frac{2\mathrm{tan}\,\theta }{1-{\mathrm{tan}}^{2}\theta }\hfill \end{array}[/latex] |
| Half-Angle Formulas | [latex]\begin{array}{l}\hfill \\ \mathrm{sin}\frac{\alpha }{2}=±\sqrt{\frac{1-\mathrm{cos}\,\alpha }{2}}\hfill \\ \mathrm{cos}\frac{\alpha }{2}=±\sqrt{\frac{1+\mathrm{cos}\,\alpha }{2}}\hfill \\ \mathrm{tan}\frac{\alpha }{2}=±\sqrt{\frac{1-\mathrm{cos}\,\alpha }{1+\mathrm{cos}\,\alpha }}\hfill \\ \mathrm{tan}\frac{\alpha }{2}=\frac{\mathrm{sin}\,\alpha }{1+\mathrm{cos}\,\alpha }\hfill \\ \mathrm{tan}\frac{\alpha }{2}=\frac{1-\mathrm{cos}\,\alpha }{\mathrm{sin}\,\alpha }\hfill \end{array}[/latex] |
| Reduction Formulas | [latex]\begin{array}{l}\hfill \\ {\mathrm{sin}}^{2}\theta =\frac{1-\mathrm{cos}\left(2\theta \right)}{2}\hfill \\ {\mathrm{cos}}^{2}\theta =\frac{1+\mathrm{cos}\left(2\theta \right)}{2}\hfill \\ {\mathrm{tan}}^{2}\theta =\frac{1-\mathrm{cos}\left(2\theta \right)}{1+\mathrm{cos}\left(2\theta \right)}\hfill \end{array}[/latex] |
| Product-to-Sum Formulas | [latex]\begin{array}{l}\hfill \\ \mathrm{cos}\alpha \mathrm{cos}\beta =\frac{1}{2}\left[\mathrm{cos}\left(\alpha -\beta \right)+\mathrm{cos}\left(\alpha +\beta \right)\right]\hfill \\ \mathrm{sin}\alpha \mathrm{cos}\beta =\frac{1}{2}\left[\mathrm{sin}\left(\alpha +\beta \right)+\mathrm{sin}\left(\alpha -\beta \right)\right]\hfill \\ \mathrm{sin}\alpha \mathrm{sin}\beta =\frac{1}{2}\left[\mathrm{cos}\left(\alpha -\beta \right)-\mathrm{cos}\left(\alpha +\beta \right)\right]\hfill \\ \mathrm{cos}\alpha \mathrm{sin}\beta =\frac{1}{2}\left[\mathrm{sin}\left(\alpha +\beta \right)-\mathrm{sin}\left(\alpha -\beta \right)\right]\hfill \end{array}[/latex] |
| Sum-to-Product Formulas | [latex]\begin{array}{l}\hfill \\ \mathrm{sin}\alpha +\mathrm{sin}\beta =2\mathrm{sin}\left(\frac{\alpha +\beta }{2}\right)\mathrm{cos}\left(\frac{\alpha -\beta }{2}\right)\hfill \\ \mathrm{sin}\alpha -\mathrm{sin}\beta =2\mathrm{sin}\left(\frac{\alpha -\beta }{2}\right)\mathrm{cos}\left(\frac{\alpha +\beta }{2}\right)\hfill \\ \mathrm{cos}\alpha -\mathrm{cos}\beta =-2\mathrm{sin}\left(\frac{\alpha +\beta }{2}\right)\mathrm{sin}\left(\frac{\alpha -\beta }{2}\right)\hfill \\ \mathrm{cos}\alpha +\mathrm{cos}\beta =2\mathrm{cos}\left(\frac{\alpha +\beta }{2}\right)\mathrm{cos}\left(\frac{\alpha -\beta }{2}\right)\hfill \end{array}[/latex] |
| Law of Sines | [latex]\begin{array}{l}\frac{\mathrm{sin}\,\alpha }{a}=\frac{\mathrm{sin}\,\beta }{b}=\frac{\mathrm{sin}\,\gamma }{c}\hfill \\ \frac{a}{\mathrm{sin}\,\alpha }=\frac{b}{\mathrm{sin}\,\beta }=\frac{c}{\mathrm{sin}\,\gamma }\hfill \end{array}[/latex] |
| Law of Cosines | [latex]\begin{array}{c}{a}^{2}={b}^{2}+{c}^{2}-2bc\,\mathrm{cos}\,\alpha \\ {b}^{2}={a}^{2}+{c}^{2}-2ac\,\mathrm{cos}\,\beta \\ {c}^{2}={a}^{2}+{b}^{2}-2ab\,\text{cos}\,\gamma \end{array}[/latex] |
ToolKit Functions
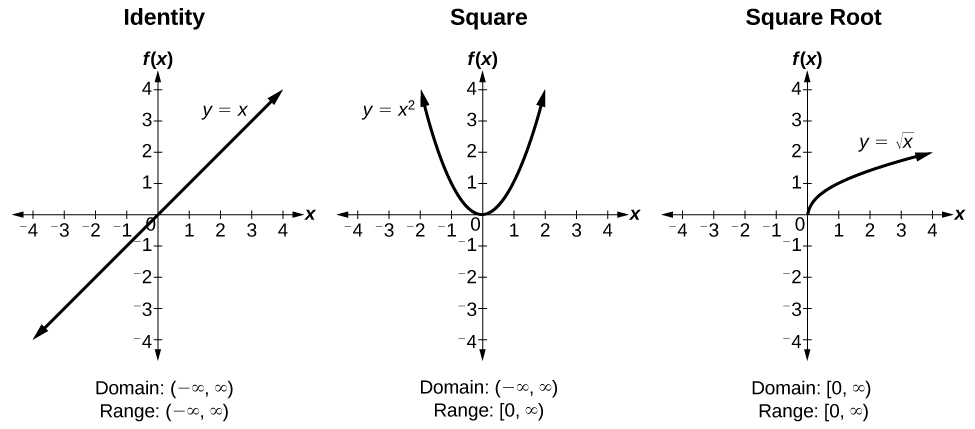
Figure 7.
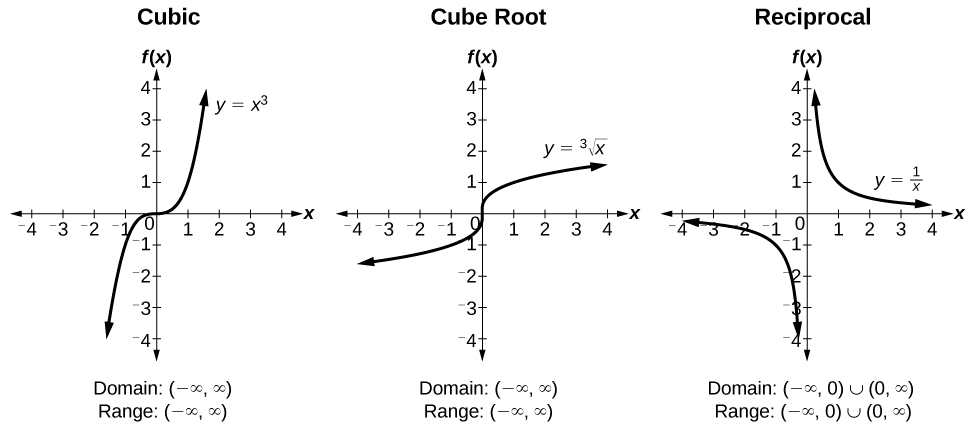
Figure 8.
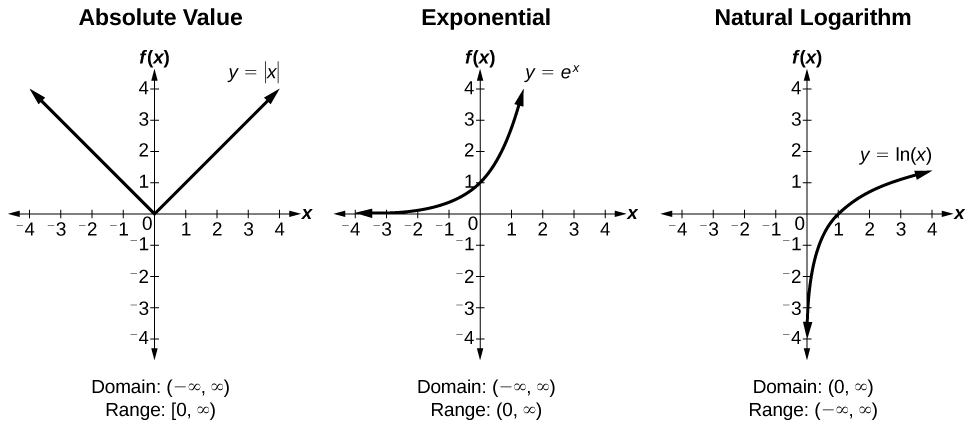
Figure 9.
Trigonometric Functions
Unit Circle
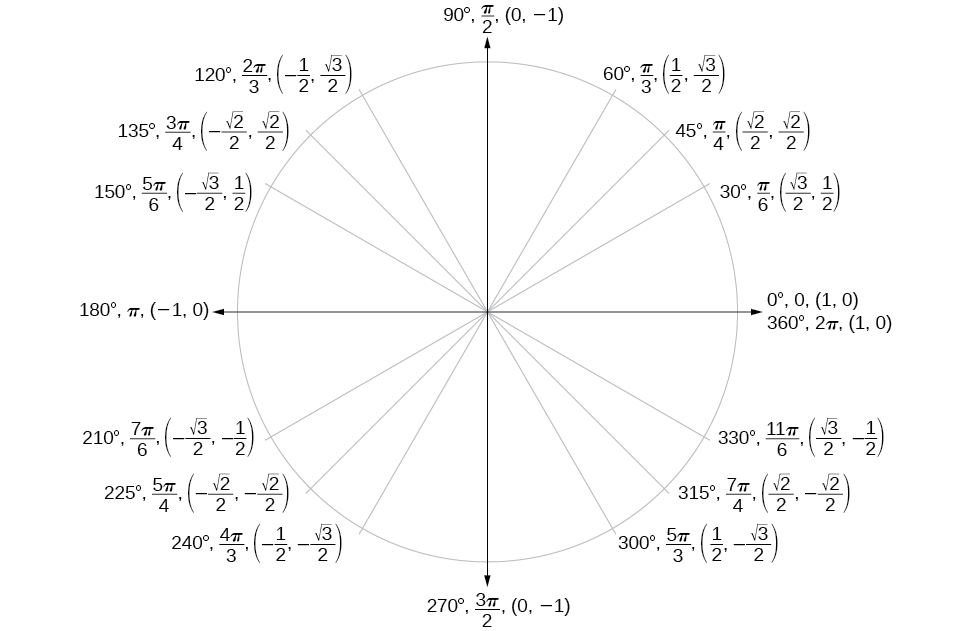
Figure 10.
| Angle | [latex]0[/latex] | [latex]\frac{\pi }{6},\text{or 30}°[/latex] | [latex]\frac{\pi }{4},\text{or 45}°[/latex] | [latex]\frac{\pi }{3},\text{or 60}°[/latex] | [latex]\frac{\pi }{2},\text{or 90}°[/latex] |
|---|---|---|---|---|---|
| Cosine | 1 | [latex]\frac{\sqrt{3}}{2}[/latex] | [latex]\frac{\sqrt{2}}{2}[/latex] | [latex]\frac{1}{2}[/latex] | 0 |
| Sine | 0 | [latex]\frac{1}{2}[/latex] | [latex]\frac{\sqrt{2}}{2}[/latex] | [latex]\frac{\sqrt{3}}{2}[/latex] | 1 |
| Tangent | 0 | [latex]\frac{\sqrt{3}}{3}[/latex] | 1 | [latex]\sqrt{3}[/latex] | Undefined |
| Secant | 1 | [latex]\frac{2\sqrt{3}}{3}[/latex] | [latex]\sqrt{2}[/latex] | 2 | Undefined |
| Cosecant | Undefined | 2 | [latex]\sqrt{2}[/latex] | [latex]\frac{2\sqrt{3}}{3}[/latex] | 1 |
| Cotangent | Undefined | [latex]\sqrt{3}[/latex] | 1 | [latex]\frac{\sqrt{3}}{3}[/latex] | 0 |
Candela Citations
- Algebra and Trigonometry. Authored by: Jay Abramson, et. al. Provided by: OpenStax CNX. Located at: http://cnx.org/contents/13ac107a-f15f-49d2-97e8-60ab2e3b519c@11.1. License: CC BY: Attribution. License Terms: Download for free at http://cnx.org/contents/13ac107a-f15f-49d2-97e8-60ab2e3b519c@11.1