What you’ll learn to do: Discuss the importance of data and identify its role in business
Andrew McAfee and Erik Brynjolfsson of MIT, discussed in a 2011 Wall Street Journal article, that “the companies that had the data they needed and used it to make decisions (instead of relying more on intuition and expertise) had the highest productivity and profitability.”
All organizations strive to make well-informed decisions. We may consider the day-to-day work and existence of organizational life as a cycle of gathering, interpreting and disseminating useful data. From the Knowledge Management (KM) field, we know that data is the most fundamental or “raw material” form of knowledge. We may consider that data “matures” as it is consumed, analyzed and worked with inside an organization. Information is data that has been analyzed for its usefulness, knowledge is information integrated into an organization’s decision-making, and wisdom is consistent application of data, information and knowledge. Your goal, regardless of your specific position or seniority in an organization, is to identify the key data, information and knowledge most germane to your role. Then work to become as proficient as possible in its dissemination and use.
In this section, we will explore the importance of data and its role in business. You may consider your role in data gathering and manipulation to be aiding your organization’s use of the data to improve its quality. Your goal is to move data to wisdom in order to help your organization improve.
Learning Outcomes
Discuss the impact of research in business reports
Discuss the steps in the research process
Identify common types of internal and external data used for business reports
Explain the role of primary research and the most common forms that are used
Explain secondary research and how it is used to provide support to the report
Identify the seven pillars of information literacy
Discuss the importance of evaluating sources and understanding biases
Describe the components of the CRAAP analysis process
Describe techniques to incorporate sources into your writing
Using Data for Impact
A business report is any formal or informal document or set of documents used to analyze a business situation and help decision-makers aid the business. Reports use data in various forms to make their claims and/or inform their audience. There are two types of business reports; both use all sorts of data:
Analytical Reports: Those used to help make a decision (e.g., whether to hire more people, expand a product line, etc.)
Informational Reports: Those used to inform people throughout the organization about something of importance.
All reports should be true, factual and helpful. An analytical report should help decision-makers with a very specific type of decision or action. Usually a decision-maker will ask him or herself, “Do I have everything I need to make an informed and quality decision?” Any reports for decisions or actions should be designed around answering this question. Additionally analytical reports should make a recommended solution, based on the data provided in the report.
Informational reports are usually shorter and simply disseminate information about organizational happenings. People are generally familiar with memos, newsletters or other similar items. Informational reports are similar to these items in that they relay something of importance to the organization. We might consider an informational report to be slightly higher in its concision and quality than a memo or newsletter, particularly based on the type of research used to illustrate the information at hand.
Business reports should be:
true, factual
concise, brief
built to help others make decisions
free from unnecessary or extra information
simple; they should address one question (i.e., well-scoped)
Often employees in a given organization who are tasked to assemble business reports will create something too broad or too detailed. This tends to happen with more junior or less-experienced individuals intent on demonstrating their skills; ironically, in business communication overall, and certainly in report writing, less is more. The writer of any report is encouraged to think like an executive:
What do I need to know right away?
How quickly do I need to make a decision?
Alfred P. Sloan, the business giant who built General Motors, famously said that his number one requirement for success was to simply “Get the Facts.”
Interestingly, perfect information is not always available or even needed. Speed, especially around decision-making, is also key. Jeff Bezos, CEO of Amazon said the following about making big decisions:[1]
Understanding Bias in Your Sources
A word on bias: some consider bias to be a problem. However, we might argue here that bias is a normal part of life and human interaction. We are all biased by our upbringing, our experiences, and our perspectives. While any attempt to be objective in your analysis is a good thing, it can be just as useful to acknowledge your biases in your research and arm the reader or consumer of your material accordingly. In a way, this is a form of respect to your readership; you acknowledge their critical thinking role in consuming your material and also acknowledge that ruling out all bias—no matter how professional or scientific one’s research approach might be—is ultimately impossible.
The following video from Chris Flipp illustrates one way to acknowledge and represent bias. It uses a term called Bracketing, that comes from a qualitative research method/idea known as Phenomenology. Bracketing is the act of reviewing and gaining awareness around your preconceived notions of a given topic before pursuing further study. This awareness should help your evaluation of sources and keep you mentally engaged in the review of your own sentiment towards your data.
The following video from Practical Psychology illustrates various biases. Note how these biases could affect your thinking, and consider ways you might apply this awareness to evaluating sources:
CRAAP Analysis
There are several tools available when evaluating sources. Perhaps the most common and well known is the (well-titled) CRAAP Analysis. The University of Santa Cruz library has a full breakdown of the CRAAP method. Below is a summarized form; CRAAP stands for:
Currency: How current is the source?
Reliability: How important is the information, and has it been consistently presented?
Authority: What is the source of the information?
Accuracy: Judged against other sources (which themselves will need appropriate evaluation), how correct is the source?
Purpose: What is the goal of the source—why was it created?
Lastly, Flinders University has an excellent commentary below on the use of Wikipedia. Depending on your organizational culture, Wikipedia might be sufficient as a source. This is hotly debated, but it all depends on the purpose of your writing. Not all of your business reports need to be lengthy and high caliber items supported by scholarly sources; you might find yourself writing a “quick” report within a day or two where your boss indicates that Wikipedia or some other introductory website (and encyclopedia maybe) is sufficient. It is important to point out that the report, while important, is not the end, it simply a means to making better decisions. Direction from your organization’s decision-makers is key.
A note on Wikipedia. While you certainly would not cite a Wikipedia article as a credible source in your essay, Wikipedia can be a great place to start to get an understanding of a topic. It may also lead you to relevant, high quality resources. Try looking at the references for a Wikipedia page (at the bottom of each Wikipedia page) and assess the quality of the references you find. Many Wikipedia entries will cite scholarly resources (including books and journal articles) in their references, which if appropriate, can then be cited in your essay.
The Human Fund
If we return to Martha’s project, we can imagine her running each secondary source through a CRAAP analysis. Her sources are likely to be a mix of books, magazine articles, videos and other media. When considering what might make for a good source for Martha, we might use a reverse version the CRAAP analysis to illustrate her analysis:
Currency
How current is the source?
Martha is not likely to use anything older than 3 to 5 years. There is no hard-and-fast rule here, but civic politics, dynamic life, technology and other features of human experience are likely to render anything too much older than 5 years less helpful.
Reliability
How important is the information, and has it been consistently presented?
Martha is likely to read or watch materials that are professionally put together and have a linked look and feel to the material.
Authority
What is the source of the information?
Martha is likely to look at sources that have a reputation of doing work in the homeless community or have done good work in other similar areas of social work.
Accuracy
Judged against other sources (which themselves will need appropriate evaluation), how correct is the source?
The bottom line here is whether the material has been reviewed by other experts. For scholarly work, we refer to this as “peer-reviewed.” Clearly not all of Martha’s sources need to be peer-reviewed; however, the more of her sources that are, the better her information will be. Flinders University recommends asking the following questions:[2]
Is it scholarly?
Is the information supported by evidence?
Is that evidence referenced by the source?
Has the content been peer-reviewed or edited by a publisher?
Can the information be verified by other literature on the same topic?
Is the tone objective and impartial?
Is it free from obvious errors such as spelling or grammar?
Is it written by a scholar with expertise in the field?
Purpose
What is the goal of the source—why was it created?
This is where intention and bias are more clear. For professional scholarly work, you will often see a note at the end of the document indicating any funding or entities that supported the work. This is there to inform the reader of external influences on the material. A professional author will work to limit his or her bias, or they will use an alternative technique, which is to discuss their bias in their work, and make their agenda clear to the reader.
Case Study: News Media Today
News media sources, such as a TV news report, must be carefully scrutinized. Here we refer to news media as major news networks, such as CNN or Fox News, local television news, and other televised news programs. These sources are unfortunately not above the tension and issues possible with less established sources. An April 2018 video criticizing Sinclair Broadcast Group highlights the dubious nature of our contemporary media landscape.
The following two videos discuss the fallout and tension:
Interestingly, the discussion has become deeply politicized. Whether the material presented is conservative or liberal is interesting, but our purpose here is to highlight how media is a contested space; it is just as difficult to get quality information here as anywhere else, and the information presented through media must be scrutinized like any other source.
Evaluation
As with evaluating websites, evaluating other media sources with the CRAAP method is appropriate. There are, however, a few added questions specific to media:
Who owns the outlet?
The above example is about Sinclair Broadcasting Group. Take a look at WebpageFX's infographic of ownership of key outlets. As you view the infographic, consider applying the CRAAP Analysis to WebpageFX. Is it a good source? Why or why not?
Figure 4.6 shows the consolidation of media ownership in the United States over a 30 year span. With consolidation of outlets, the plurality of available media and variation in beliefs and political stances represented has diminished.
Figure 4.4. Media consolidation from 1983 to 2011
In plural democracies like the US and other Western nations, this is certainly a concern. To what extent do the media play a role in homogenizing American life? To what extent should we be concerned this affects our freedom and ability to live and exist with others with whom we might disagree, yet arguably should respect?
How long has the media outlet been around?
While not a perfect test of quality by any means, consider how something like 60 Minutes, the news magazine from CBS, has been on the air for over 40 years. Would this make it more or less reputable than, for example, a newer YouTube news channel, e.g., The Young Turks or The Rubin Report.
In the above discussion, we noted how quickly the use of media becomes politicized. Consider the use of mass media sources carefully given this potential problem. A good technique would be to simply address what you (as the researcher) think the bias might be. As we’ve discussed elsewhere, it's not as simple as saying all bias is bad, but rather, bias is something we all encounter and have, and it is reasonable and useful to address bias head-on. The researcher should tell the reader what their biases are; the researcher should tell the reader what they think a given source’s biases are as well. The onus is on the reader always to think critically on the material presented.
Synthesizing Sources
Using Your Sources
There are three methods for referencing a source in your own text: quoting, paraphrasing, and summarizing.
Quoting
Direct quotations are words and phrases that are taken directly from another source and then used word-for-word in your text. If you incorporate a direct quotation from another author's text, you must put that quotation or phrase in quotation marks to indicate that it is not your language.
When writing direct quotations, you can use the source author’s name in the same sentence as the quotation to introduce the quoted text and to indicate the source in which you found the text. You should then include the page number or other relevant information in parentheses at the end of the phrase or use footnotes or end notes to cite the source. (The exact format will depend on the formatting style of your essay).
Paraphrasing
When paraphrasing, you may put any part of a source (such as a phrase, sentence, paragraph, or chapter) into your own words.
You may find that the original source uses language that is more clear, concise, or specific than your own language, in which case you should use a direct quotation, putting quotation marks around those unique words or phrases you don’t change. It is common to use a mixture of paraphrased text and quoted words or phrases, as long as the direct quotations are inside of quotation marks. You must still cite the source even if you rephrase their idea in your own words.
Summarizing
Summarizing involves distilling the main idea of a source into a much shorter overview. A summary outlines a source’s most important points and general position. When summarizing a source, it is still necessary to use a citation to give credit to the original author. You must reference the author or source in the appropriate citation at the end of the summary.
Integrating Material from Sources
Incorporating sources into your writing uses a general pattern.
You make a claim or point, e.g., “The Human Fund helps >25% of the downtown Chicago homeless population.”
You cite evidence, e.g. an MLA citation or APA citation, by embedding a hyperlink in a digital document, by paraphrasing, or by using a direct quote.
You segue to another claim or new point.
The relationship between claim and evidence is key; for your writing to be effective, you must back up claims or knowledge with quality evidence (sources).
Integrating materials from sources into your own text can be tricky; if we consider the metaphor that writing a paper and including sources is a way of facilitating a conversation about a topic, it helps us to think about how this will work best . When you're discussing a topic in person with one or more people, you will find yourself referring to outside sources: “When I was watching the news, I heard them say that . . . I read in the newspaper that . . . John told me that . . .” These kinds of phrases show instances of using a source in conversation and ways that we automatically shape our sentences to work references to the sources into the flow of conversation.
Think about this next time you try to work a source into a piece of writing: if you were speaking this aloud in conversation, how would you introduce the material to your listeners? What information would you give them in order to help them understand who the author was, and why their view is worth referencing? After giving the information, how would you then link it back to the point you were trying to make? Just as you would do this in a conversation if you found it necessary to reference a newspaper article or television show you saw, you also need to do this in your essays.
McAfee, Andrew and Erik Brynjolfsson. "What Makes a Company Good at IT?" Wall Street Journal, April 25, 2011. Web. 12 June 2018.
Most decisions should probably be made with somewhere around 70 percent of the information you wish you had. If you wait for 90 percent, in most cases, you’re probably being slow. Plus, either way, you need to be good at quickly recognizing and correcting bad decisions. If you’re good at course correcting, being wrong may be less costly than you think, whereas being slow is going to be expensive for sure.
We might extrapolate from Bezos's quote that he likely means the 70 percent of information you have, however, must be true. So the issue here may not be volume of information but rather having enough good/true information to make a reasonable move forward (i.e., a decision).
As mentioned above, at the heart of good research is the proper use and interpretation of data.
Data are all the rage these days. “Big Data,” “Data Analytics,” “Data Science” and other varieties of data use and exploitation are very useful for making key decisions. It can be hard to determine what data is useful. If we define data as, “plain facts, usually numbers,” as Elon University does[footnote]Elon University. "Data and Statistics.", that means we need first to understand the type of data we need, then we have to understand its source(s), and lastly, we have to make sense of the data for our purposes. This requires a research mindset, and it requires us to view report writing as essentially a research project. Through this module, we will address these issues through the lens of research.
Investing Time in the Research Process
This page discusses a general research process, one that is useful in a variety of organizations to support report writing. We borrow the process largely from social science, where the focus is answering a question or gaining insight about human affairs. The general research process is usually as follows:
Determine a problem and define a question to answer.
Find general background about your problem/question.
Develop a research strategy to address any data, information or knowledge gaps. These gaps may be referred to as “sub-questions.”
Conduct research.
Collect, read, evaluate and write what you have learned.
Cite the information you have found so that others will be able to follow your research trail.
The Human Fund
Consider Martha’s case as a study or illustration of the above process. Martha is a junior analyst with The Human Fund, a business in Chicago specializing in selling local handicraft goods made by homeless families. The Human Fund supplies raw materials such as yarn, cloth, leather or other items, training homeless participants in their use and then providing a safe place to make clothing, bags, and other items. The organization has experienced fairly consistent growth in their three years of operation and has received excellent local press for its help to the city.
Martha’s boss directs her to study whether their work is benefiting families in the downtown area because the company’s leadership is considering whether to put more resources into that neighborhood. Martha considers her assignment and does the following:
She determines her research question: “Is The Human Fund’s work helping homeless families in downtown Chicago?” Martha also considers that the business report’s central goal is not necessarily answering ONLY whether their organization is benefiting downtown Chicago already, but also whether The Human Fund should do more in downtown Chicago. She decides to proceed with her research question but tells herself to write up the report later in a way that will help the executives make their decision about whether to expand operations downtown.
She sets aside about 10–20 hours for general online reading/fact-finding, primarily from major newspapers and social services websites. During her general background reading, she collects various facts, figures and other data. Most of this data is quantifiable data, or data that has numbers associated with it. For example, she learns that various charities and the Chicago city government estimate that around 2,000 people are homeless downtown. There is some mention of The Human Fund in downtown-oriented press, but there's nothing that shows their specific impact. She identifies various gaps in her data and determines she will need to do further research outside the office.
Her largest gap in data is hearing from the downtown homeless themselves. She could not find sources that discussed the downtown homeless experience or had any quotes or other qualitative (non-numeric) data. She decides to visit with several families downtown over the course of a week. She plans to talk to as many families as she can. To frame her interaction, she develops three sub-questions:
Do you know about The Human Fund and its mission?
Have you sold goods through The Human Fund?
If yes, has the The Human Fund helped you?
Are you still working with us (The Human Fund)?
Would you like to sell goods through the Human Fund?
Martha’s technique is a structured interview or survey. She has structured questions that will yield a fairly straightforward and closed (yes/no) type answer. While interviewing, she can make a note of how many people she talks to, how many answer a certain way, and based on other data she found in her general reading—particularly the total number of estimated homeless in downtown Chicago—she can gain an understanding of The Human Fund’s current impact, and possible expansion.
Martha visits with several homeless families downtown, and determines the following:
25 percent of her respondents (74 families asked over a week) know about the Human Fund.
Of the 19 families that have heard of the Human Fund, 10 have made and sold goods with The Human Fund.
Of the 10 families that have made and sold goods through the Human Fund, 9 said they benefited from the help.
Of the 9 that said they benefited from the help, all 9 families plan to continue the interaction.
Of the 55 families she polled who had not heard of The Human Fund, 25, or 45 percent, expressed an interest in learning more.
Martha begins writing up her report. In the report, she clearly outlines her research question, the background reading, the gaps in data she found in the background reading, the field research and sub-questions, and the data gathered from the fieldwork.
Martha is careful to cite all of her work. For her background reading, she hyperlinks to various newspapers or other sources, and for her fieldwork, she gives general data on whom she talked to (e.g., “family of four, sleeping on the streets off of Lake Shore Drive, dad’s name is George).
The above process is one possible way to conduct research. It reflects the general approach to social science inquiry, which seeks to answer a specific (as specific as possible) question about a human circumstance. In Martha’s case, she will now need to develop a report that quickly and concisely details what she found. Most importantly, Martha needs to consider what type of informed recommendation she should make to her boss. Types of Data Sources
Figure 4.3 shows frequency data—the amount of something over a given period of time.
[caption id="attachment_4913" align="aligncenter" width="1000"] Figure 1. Comparison of word usage from 1600 to 2018[/caption]
Various types of data are very useful for business reports, and in business reports, you will quickly come across things like revenue (money earned in a given period, usually a year), turnover (people who left the organization in a given period), and many others.
There are a variety of data available when one is constructing a business report. We may categorize data in the following manner:
Size of the industry (e.g. number of companies, total capital)
Internal and external business or organizational data come in two main categories: qualitative and quantitative.
Qualitative data are data that are generally non-numeric and require context, time, or variance to have meaning or utility.
Examples: taste, energy, sentiments, emotions
Quantitative data are data that are numeric and therefore largely easier to understand.
Example: temperature, dimensions (e.g., length), prices, headcount, stock on hand
Both types of data are useful for business report writing. Usually a report will feature as much “hard” quantitative data as possible, typically in the form of earnings or revenue, headcount, and other numerical data available. Most organizations keep a variety of internal quantitative data. Qualitative data, such as stories, case studies, or narratives about processes or events, are also very useful, and provide context. We may consider that a good report will have both types of data, and a good report writer will use both types of data to build a picture of information for their readers.
10-K
A common report required of all publicly traded companies is the 10-K. This is an annual report that all public companies in the US have to file with the US Securities and Exchange Commision (SEC). For example, you can take a look at Apple’s 10-K.
Figure 2 shows Apple's 10-K’s table of contents, and illustrates common types of data used. Note how much of it is quantitative based (Item 6 for example,) however other data, such as leadership biographies (Item 10), also provides context.
[caption id="attachment_4914" align="aligncenter" width="500"] Apple's 10-K[/caption]
Primary Research
Primary research is usually defined as research you collect yourself. This type of research is done to fill in gaps found during secondary research review. That is, one does not conduct primary research if you can address your research question with already existing secondary sources.
Think back to Martha’s case we discussed earlier in this module; her interviews of homeless people in downtown Chicago are primary research. She is doing these interviews only because her existing secondary sources lack something she feels she needs now to properly answer her research question (about the current experience of homeless families in downtown Chicago). Primary research is used to supplement gaps in more accessible secondary research (covered in greater detail in the next sub-module).
Purdue University’s Online Writing Lab describes the following as typical primary research:
Interviews: Interviews are conversations, typically in small groups, where one party asks questions of another. Interviews are usually conducted in-person, between two people (the person asking questions and the person answering them); however, these can also take place over the phone, and may involve multiple parties.
Surveys: Surveys are typically written documents that are sent out to individuals to fill out. Surveys are more rigid than interviews, as an interviewer can change their planned questions based on the subject's responses. Surveys, however are pre-written and can only respond in limited anticipated ways.
Observations: Observations are just what they sound like: the researcher watches something and records what they see. It is important to avoid influencing whatever you're watching. However, if it's impossible to not influence your subject, make sure to include the fact that your presence may have influenced your observations.
Analysis: In analysis, gathered data is examined and organized so those who are less familiar with technical details can be guided through the data. Analysis can also help uncover patterns and trends in data.
Secondary Research
Secondary research is gathering information from other people’s primary research. Common forms are books, journals, newspaper articles, media reports, and other polished accounts of data. Most will use secondary sources for their business reports; the value-added is to gather, curate, and present the material in a new, updated and helpful manner. It is far less costly, more efficient, and requires less time to gather data from already built sources. In business, where everything has a cost, we may argue that we hope we can answer our research needs through secondary sources alone.
Primary research is expensive and time consuming. That said, primary and secondary data should interact, and as discussed, we gather primary data when we find gaps in what is already available from secondary sources.
One example of a "good" secondary source is this McKinsey and Company discussion on data and analytics in business. Later in the module, you’ll learn how to assess a source. Consider coming back to the McKinsey piece here and running the source through these tests and frameworks.
What you'll learn to do: Evaluate and practice methods of analysis to assess the quality and reliability of a source
Sources come in all shapes and sizes. In order to use them effectively in your report writing, you will have to assess their quality and reliability.
In this section, we will look at a few of the more prominent and well-known techniques; these will be more than sufficient for most of your report writing needs. After you review and practice this material, you should feel confident in evaluating sources and will have the key tools to determine the best ones to use.
Information Literacy
People will often talk about the importance of information literacy, but just what does it mean to be information literate? The American Library Association defines information literacy as the ability to "recognize when information is needed and have the ability to locate, evaluate, and use effectively the needed information."[footnote]American Library Association. Presidential Committee on Information Literacy. Final Report. (Chicago: American Library Association, 1989.)
The Society of College, National and University Libraries (SCONUL) 7 Pillars of Information Literacy provides a framework strategy for assembling material for your research project. If you follow this strategy, you can consider yourself information literate.
The pillars are as follows:
Identify what you need to find out.
Assess current knowledge, identify your personal knowledge gaps, and understand what types of information are available.
Plan where you'll locate data and how you'll use it.
Gather data needed, keeping track of where you found your information
Evaluate both your research process and the information your find; compare and analyze data.
Manage the information you've gathered professionally and ethically—cite all of your sources.
Present the knowledge you've gained, disseminating information to others and apply your knowledge to your life.
Once you've evaluated your personal skill set, you can identify gaps in your current material or sources. This can be particularly helpful when determining whether any primary source research is required, and especially whether you would need to conduct any of your own fieldwork (i.e., surveys, interviews, observations, etc.).
Watch This
This video provides an alternate presentation of the seven pillars, diving into each component a bit deeper.
Evaluating Sources
Perhaps never before in mainstream discussion has the importance of evaluating sources been more important. The effect of “fake news,” and contested information is now a common feature of contemporary life. When evaluating sources, for which a variety of good techniques and rules of thumb exist, we argue that doing so is an essential part of critical thinking, which is the bedrock for good communication and report writing in any field.
The Human Fund
To illustrate the importance of evaluating sources, consider our case study with Martha of The Human Fund. Recall that she read a variety of secondary source materials after developing her research question. In addition to ensuring her sources were scoped properly—that they addressed elements of her research question—she would need to evaluate their authorship, determine how recent and reliable the information is, and understand any bias.
Evaluating Websites
As our world becomes more and more connected by technology, our ability to evaluate and use information has become more difficult, but not impossible. It is essential to understand how these technologies work and how people use them.
Websites, broadly speaking, are perhaps the most difficult sources to evaluate; however, the following tips can act as basic guidelines:
Consider the URL: generally speaking, .com, .org, .ac.uk, .edu and other more common domains are a bit more likely to have reliable and good content.
What type of website is it? If it is a blog, social media site, or other tool for personal expression, proceed with caution. Much of the “fake news” problem is driven by sharing questionable material on social media.
What is the main purpose or claim of the website? Be careful with websites interested in selling downloadable information sources, such as “How to Conduct Research” or “Make Money in Real Estate.” The content may be accurate and useful; however, the sheer abundance of poor sources means you should only use these types of data/sources with caution.
Learn More
While we've boiled the evaluation of websites down to a few key tips, it is actually a complex topic that could fill books. For more information, check out Mike Caulfield's Web Literacy for Student Fact-Checkers.
This book is (as stated in its own introduction) "an unabashedly practical guide for the student fact-checker. It supplements generic information literacy with the specific web-based techniques that can get you closer to the truth on the web more quickly."[footnote]Caulfield, Mike. "Why This Book?" Web Literacy for Student Fact-Checkers. Web. 30 June 2018. ↵


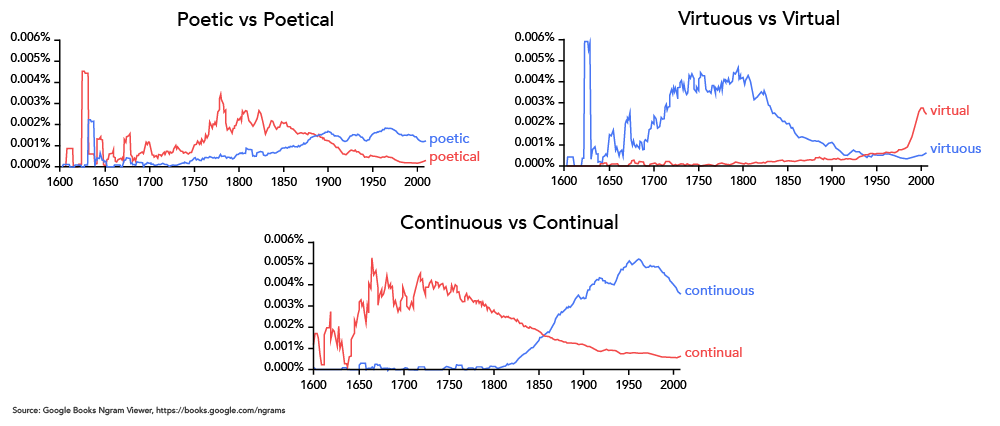 Figure 1. Comparison of word usage from 1600 to 2018[/caption]
Various types of data are very useful for business reports, and in business reports, you will quickly come across things like revenue (money earned in a given period, usually a year), turnover (people who left the organization in a given period), and many others.
There are a variety of data available when one is constructing a business report. We may categorize data in the following manner:
Figure 1. Comparison of word usage from 1600 to 2018[/caption]
Various types of data are very useful for business reports, and in business reports, you will quickly come across things like revenue (money earned in a given period, usually a year), turnover (people who left the organization in a given period), and many others.
There are a variety of data available when one is constructing a business report. We may categorize data in the following manner:
 Apple's 10-K[/caption]
 Sources come in all shapes and sizes. In order to use them effectively in your report writing, you will have to assess their quality and reliability.
In this section, we will look at a few of the more prominent and well-known techniques; these will be more than sufficient for most of your report writing needs. After you review and practice this material, you should feel confident in evaluating sources and will have the key tools to determine the best ones to use.
Sources come in all shapes and sizes. In order to use them effectively in your report writing, you will have to assess their quality and reliability.
In this section, we will look at a few of the more prominent and well-known techniques; these will be more than sufficient for most of your report writing needs. After you review and practice this material, you should feel confident in evaluating sources and will have the key tools to determine the best ones to use.