Learning Objectives
In this module, the following topics will be covered: 1) definition of public health, 2) public health impacts of non-sustainable development, 3) key public health impacts of climate change.
After reading this module, students should be able to:
- understand what public health is
- recognize public health impacts of non-sustainable development
- identify key public health impacts of climate change
Introduction
“Much discussion about sustainability treats the economy, livelihoods, environmental conditions, our cities and infrastructure, and social relations as if they were ends in themselves; as if they are the reason we seek sustainability. Yet their prime value is as the foundations upon which our longer-term health and survival depend.” (McMichael, 2006)
Ecological sustainability is more than just continuing the resource flows of the natural world to sustain the economic machine, while maintaining diversity of species and ecosystems. It is also about sustaining the vast support systems for health and life which could be considered the real bottom line of sustainability. Before examining the public health effects of non-sustainable development, we should define public health.
- The website for UIC’s School of Public Health says “we are passionate about improving the health and well-being of the people of Chicago, the state of Illinois, the nation and the world.”
- The Illinois Department of Public Health is responsible for protecting the state’s 12.4 million residents, as well as countless visitors, through the prevention and control of disease and injury.”
- The New Zealand Ministry of Health defines it as “the science and art of promoting health, preventing disease and prolonging life through organized efforts of society.”
- The National Resources Defense Council an NGO devoted to environmental action, states that public health is “the health or physical well-being of a whole community.”
Impacts of Non-Sustainable Development
We have built our communities in ways that are unsustainable from many aspects. Not only does development create urban sprawl, impact land use, and fuel consumption, we can identify negative health consequences related to these development trends.
Obesity
If our communities are not walkable or bikeable, we need to drive to schools, shops, parks, entertainment, play dates, etc. Thus we become more sedentary. A sedentary lifestyle increases the risk of overall mortality (2 to 3-fold), cardiovascular disease (3 to 5-fold), and some types of cancer, including colon and breast cancer. The effect of low physical fitness is comparable to that of hypertension, high cholesterol, diabetes, and even smoking (Wei et al., 1999; Blair et al., 1996).
Economic Segregation
Walkable and safe communities provide sidewalks, bike paths, proximity, and connections to community services such as grocery stores, schools, health care, parks, and entertainment. Community design that creates a segregated housing environment with only expensive housing and no affordable housing segregates people by socio-economic level (i.e. poor from non-poor) and this generally leads to segregation by race. Lack of physical activity will occur in neighborhoods with no good green and safe recreational sites. If we have poor public transit systems partly due to lack of density (only more expensive, low-density housing) and our love of the automobile, then we have increased emissions that contribute to global warming.
The Olympics as an Example
A natural experiment during the 1996 Summer Olympic Games in Atlanta shows the impact of car use on health. During the games, peak morning traffic decreased 23% and peak ozone levels decreased 28%. Asthma-related emergency room visits by children decreased 42% while children’s emergency visits for non-asthma causes did not change during same period (Friedman, Powell, Hutwagner, Graham, & Teague, 2001). We also saw that with the Beijing Olympics in 2008 where driving days were rationed, more than 300,000 heavy-emitting vehicles (about 10% of total) were barred from the city’s administrative area in order to decrease pollution for athletes and visitors This reduced the number of vehicles by about 1.9 million or 60% of the total fleet during the Olympic Games. Emissions of black carbon, carbon monoxide and ultrafine particles were reduced by 33%, 47%, and 78% respectively compared to the year before the Olympics. Frequency of respiratory illnesses during the 2008 games were found to be significantly less in certain populations compared to previous years and this was hypothesized to be related to the reduction of vehicles on the road (Wang et al., 2009; Jentes et al., 2010).

Minutes Americans Walk per Day Source: National Household Travel Survey, 2001, USDOT
Figure Minutes Americans Walk per Day shows the average time Americans spend walking a day. People who walk to and from public transit get an fair amount of physical activity related to using transit, thus the name given to modes of transit that do not involve driving: active transit. Those people who did not own a car or were not a primary driver had higher walking times (Besser & Dannenberg, 2005).
Water Quality
Increasing numbers of roads and parking lots are needed to support an automobile transportation system, which lead to increased non-point source water pollution and contamination of water supplies (road runoff of oil/gas, metals, nutrients, organic waste, to name a few) with possible impacts on human health. Increased erosion and stream siltation causes environmental damage and may affect water treatment plants and thus affect water quality.
Social Capital
On the social sustainability side, we can look at social capital otherwise defined as the “connectedness” of a group built through behaviors such as social networking and civic engagement, along with attitudes such as trust and reciprocity. Greater social capital has been associated with healthier behaviors, better self-rated health, and less negative results such as heart disease. However, social capital has been diminishing over time. Proposed causes include long commute times, observed in sprawling metropolitan areas. Past research suggests that long commute times are associated with less civic participation; Robert Putnam suggests that every ten additional minutes of commuting predicts a 10% decline in social capital (Besser, Marcus, & Frumkin, 2008). Urban sprawl is considered the reason for most long commutes.
As of 2011, according to an article in the Chicago Tribune, Chicago commuting times are some of the worst – with Chicagoans spending 70 hours per year more on the road than they would if there was no congestion – up from 18 hours in 1982. They have an average commute time of 34 minutes each way. These drivers also use 52 more gallons per year per commuter, increasing their costs and pollution.
Residents of sprawling counties were likely to walk less during leisure time, weigh more, and have greater prevalence of hypertension than residents of compact counties (Ewing, Schmid, Killingsworth, Zlot, & Raudenbush, 2003).
While more compact development is found to have a negative impact on weight, we also find that individuals with low BMI are more likely to select locations with dense development. This suggests that efforts to curb sprawl, and thereby make communities more exercise-friendly, may simply attract those individuals who are predisposed to physical activity (Plantinga & Bernell, 2007).
Impacts of Climate Change
Public health studies have been conducted with regard to many of the predicted environmental effects of climate change. Thus, it is somewhat easier to examine the public health implications of this outcome of unsustainable behavior. Figure How Climate Change Affects Population describes the pathways by which climate change affects public health. To the left we see the natural and anthropogenic, or human-caused activities that affect climate change, which result in climatic conditions and variability; if we can mitigate those events we can reduce climate change. These activities first result in environmental impacts such as severe weather events, disturbed ecosystems, sea-level rise, and overall environmental degradation. Those impacts can then result in a broad range of health effects that we can adapt to, to a certain extent. These impacts are generally categorized into three areas: heat induced morbidity and mortality, infectious diseases, and impacts due to the effect of extreme weather such as flooding and drought on the social welfare of the population.
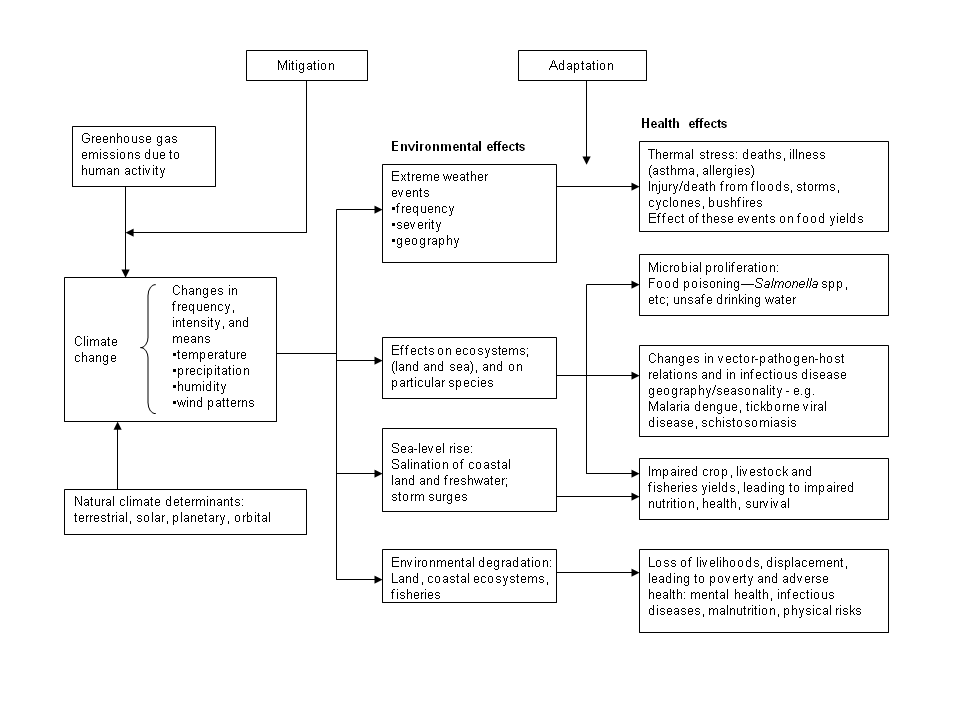
How Climate Change Affects Population Diagram summarizing the main pathways by which climate change affects population health. Source:Created by Cindy Klein-Banai, based on McMichael et al., 2006
Measurement of health effects from climate change can only be very approximate. One major study, by the World Health Organization (WHO), was a quantitative assessment of some of the possible health impacts that looked at the effects of the climate changes since the mid-1970s and determined that this may have resulted in over 150,000 deaths in 2000. The study concluded that the effects will probably grow in the future (World Health Organization, 2009).
Extreme Weather
Climate change can influence heat-related morbidity and mortality, generally a result of the difference between temperature extremes and mean climate in a given area. Higher temperatures in the summer increase mortality. Studies on the effects of heat waves in Europe indicate that half of the excess heat during the European heat wave of 2003 was due to global warming and, by inference, about half of the excess deaths during that heat wave could be attributed to human-generated greenhouse gas emissions (see Haines, Kovats, Campbell-Lendrum, & Corvalan, 2006; Hellmann, Lesht, & Nadelhoffer, 2007; McMichael, 2006). Urban centers are more susceptible due to the urban heat island effect that produces higher temperatures in urban areas as compared to the near-by suburbs and rural areas. Lack of vegetation or evaporation, and large areas of pavement, in cities result in an “Urban Heat Island,” where urban areas are warmer than the neighboring suburban and rural areas (See Figure Sketch of an Urban Heat-Island Profile). Adaptation can help reduce mortality through greater prevention awareness and by providing more air-conditioning and cooling centers.

Sketch of an Urban Heat-Island Profile. Source: Heat Island Group.
The reduction of extreme cold due to global warming, could reduce the number of deaths due to low temperatures. Unlike for heat, those deaths are usually not directly related to the cold temperature itself but rather to influenza. Also, deaths related to cold spells would increase to a lesser extent by (1.6%), while heat waves increase them by 5.7%.
Since volatile organic compounds are precursors of ozone, and VOC emissions increase with temperature, this could lead to an increase in ozone concentrations. For fifteen cities in the eastern United States, the average number of days exceeding the health-based eight-hour ozone standard is projected to increase by 60 percent (from twelve to almost twenty days each summer) by the 2050s because of warmer temperatures (Lashof, & Patz, 2004). Pollen levels may increase with increased CO2 levels since that promotes growth and reproduction in plants. This will increase the incidence of allergic reactions. Similarly, poison ivy will grow more and be more toxic.
Infectious diseases are influenced by climate as pathogen survival rates are strongly affected by temperature change. Diseases carried by birds, animals, and insects (vector-born) – such as malaria, dengue fever, and dengue hemorrhagic fever – may be influenced by temperature as mosquitoes are sensitive to climate conditions such as temperature humidity, solar radiation, and rainfall. For example, there has been a strengthening of the relationship between the El Nino global weather cycle and cholera outbreaks in Bangladesh. Increases in malaria in the highlands of eastern Africa may be associated with local warming trends. Temperature also affects the rate of food-born infectious disease. In general, however, it is hard to isolate the effects of climate change that affect the transmission rate and geographic boundaries of infectious disease from other social, economic, behavioral, and environmental factors (see McMichael et al., 2006). Increased precipitation from extreme rainfall events can cause flooding which, especially in cities with combined sewer and stormwater systems can be contaminated by sewage lines. This can happen when the deep tunnels <!–(see Figure Deep Tunnels)–> that carry stormwater in Chicago reach capacity and untreated sewage then must be released into Lake Michigan. E. Coli levels in the lake then increase, forcing beaches to close to prevent the spread of infection.
<!–
Deep Tunnels Rays of daylight light up the vertical tunnel under Miller Meadow Forest Preserve in Maywood, IL, part of the deep tunnel. Source: Chicago Tribune / May 8, 1990.–>
Diseases are re-emerging and emerging infectious due to intensified food production in “factory” farms. Examples include mad cow disease (1980s in Britain); the encroachment on rain forest by pig farmers exposed pigs and farmers to the “Nipah” virus carried by rainforest bats that were seeking food from orchards around the pig farms – driven by deforestation and the drought of El Nino. This caused infection of pigs which lead to human illness and more than one hundred deaths. Poultry farming (avian influenza viruses) – crowded ‘factory farming’ may increase the likelihood of viral virulence when there is no selective advantage in keeping the host bird alive. Other food related issues are discussed in the next section.
Food Production
Climate change can influence regional famines because droughts and other extreme climate conditions have a direct influence on food crops and also by changing the ecology of plant pathogens (Patz et al., 2005).
There are likely to be major effects of climate change on agricultural production and fisheries. This can be both positive and negative depending on the direct effects of temperature, precipitation, CO2, extreme climate variations, and sea-level rise. Indirect effects would have to do with changes in soil quality, incidence of plant diseases and weed and insect populations. Food spoilage will increase with more heat and humidity. Persistent drought has already reduced food production in Africa. There could be reduction in nutritional quality due to a reduction in the amount of nitrogen crops incorporate when CO2 levels increase.
Malnutrition will be increased due to drought, particularly poorer countries. Increasing fuel costs also increase the cost of food, as we are already seeing in 2011. Again, this incremental cost rise affects those who already spend a large portion of their income on food and can contribute to malnutrition. About one-third, or 1.7 billion, of all people live in water-stressed countries and this is anticipated to increase to five billion by 2025. Frequency of diarrhea and other diseases like conjunctivitis that are associated with poor hygiene and a breakdown in sanitation may increase.

Projection for Future EHW-like Summers in Chicago. The average number of summers per decade with mortality rates projected to equal those of the Chicago analog to the European Heat Wave of 2003. Values shown are the average of three climate models for higher (orange) and lower (yellow) emission scenarios for each decade from 1980 to 2090 Source: Hellmann et al., 2007.
Various studies suggest that increases in population at risk from malnutrition will increase from 40-300 million people over the current 640 million by 2060 (Rosenzweig, Parry, Fischer & Frohberg, 1993). A more recent study said that today 34% of the population is at risk and by 2050 this value would grow to 64-72%. Climate change is associated with decreased pH (acidification) of oceans due to higher CO2 levels. Over the past 200 years ocean pH has been reduced by 0.1 units and the IPCC predicts a drop of 0.14 to 0.35 units by 2100. This may affect shell-forming organisms and the species that depend on them. There could be a reduction in plankton due to the North Atlantic Gulf Stream (Pauly & Alder, 2005). With already overexploited fish populations, it will be harder for them to recover.
Natural disasters like floods, droughts, wildfires, tsunamis, and extreme storms have resulted in millions of deaths over the past 25 years and negatively affected the lives of many more. Survivors may experience increased rates of mental health disorders such as post-traumatic stress disorder. Wildfires reduce air quality, increasing particulate matter that provokes cardiac and respiratory problems. Sea level rise will increase flooding and coastal erosion. Indirect effects of rising sea levels include the infiltration of salt water and could interfere with stormwater drainage and sewage disposal. This could force coastal communities to migrate and create refugees with health burdens such as overcrowding, homelessness, and competition for resources. Air pollution is likely to be worse with climate change. It can also lead to mobilization of dangerous chemicals from storage or remobilize chemicals that are already in the environment.
Specific regional effects have may be more severe. Vulnerable regions include temperate zones predicted to experience disproportionate warming, areas around the Pacific and Indian Oceans that are currently subject to variability in rainfall, and large cities where they experience the urban heat island effect (Patz et al., 2005). The Chicago area is one urban area where analysis has been performed to determine the specific health effects that are projected due to climate change (see Figure Projection for Future EHW-like Summers in Chicago). Those effects are similar to the ones described above.
An evaluation of the reductions in adverse health effects that could be achieved by 2020 in four major cities with a total population of 45 million found that GHG mitigation would “reduce particulate matter and ozone ambient concentrations by about 10% and avoid some 64,000 premature deaths, 65,000 person-chronic bronchitis case, and 37 million days of restricted activities (Cifuentes, Borja-Aburto, Gouveia, Thurston & Davis, 2001). The cities’ ozone levels are estimated to increase under predicted future climatic conditions, and this effect will be more extreme in cities that already suffer from high pollution. The estimates of elevated ozone levels could mean a 0.11% to 0.27% increase in daily total mortality (Bell et al., 2007). Therefore, reduction of GHG emissions, along with actions to mitigate the effects of climate change are likely to reduce the public health outcomes associated with climate change.
Conclusions
The implications of climate change on public health are broad and vast. The interconnectedness of all of earth’s systems and human health is an area that is a challenge to study; the climate change scenarios are variable. Public health is directly tied to the human ecosystem that we create through our unsustainable activities. The deterioration of public health on this planet is perhaps the most important consequence of our own unsustainable choices. Without good public health outcomes, human life on this planet is threatened and ultimately our actions could cause significant changes in human health, well-being and longevity. It is not the earth that is at stake – it is humanity.
Review Questions
Think about the major sources of energy: coal, nuclear and petroleum. Name some health effects that are associated with each, as portrayed in recent world events. Find one popular and one scientific source to support this.
Describe three health impacts of climate change.
Modern farming practices are meant to increase productivity and feed the world solving the problems of malnutrition and starvation. How would you argue for or against this?
What are some outcomes that could be measured to determine if a community is healthy?
Resources
Health Impacts of Climate Change – Society of Occupational and Environmental Health http://www.youtube.com/watch?v=aLfhwaS677c
References
Bell, M. L., Goldberg, R., Hogrefe, C., Kinney, P. L., Knowlton, K., Lynn, B., . . . Patz, J. A. (2007). Climate change, ambient ozone, and health in 50 US cities. Climatic Change, 82, 61-76.
Besser L. M., & Dannenberg A. L. (2005, November). Walking to public transit steps to help meet physical activity recommendations. American Journal of Preventive Medicine, 29(4), 273-280.
Besser, L. M., Marcus, M., & Frumkin, H. (2008, March). Commute time and social capital in the U.S. American Journal of Preventive Medicine, 34(3), 207-211.
Blair S. N., Kampert, J. B., Kohl III, H. W., Barlow, C. E., Macera, C. A., Paffenbarger, Jr, R. S., & Gibbons, L. W. (1996). Influences of cardiorespiratory fitness and other precursors on cardiovascular disease and all-cause mortality in men and women. Journal of American Medical Association, 276(3), 205-210.
Cifuentes, L., Borja-Aburto, V. H., Gouveia, N., Thurston, G., & Davis, D. L. (2001). Hidden health benefits of greenhouse gas mitigation. Science, 293(5533), 1257-1259.
Ewing, R., Schmid, T., Killingsworth, R., Zlot, A., & Raudenbush, S. (2003, September/October). Relationship between urban sprawl and physical activity, obesity, and morbidity. American Journal of Health Promotion, 18(1), 49-57.
Friedman, M. S., Powell, K. E., Hutwagner, L., Graham, L. M., & Teague, W. G. (2001). Impact of changes in transportation and commuting behaviors during the 1996 Summer Olympic Games in Atlanta on air quality and childhood asthma. JAMA: The Journal of the American Medical Association, 285(7), 897–905.
Haines, A., Kovats, R. S., Campbell-Lendrum, D., & Corvalan, C. (2006). Climate change and human health: Impacts, vulnerability and public health. Journal of the Royal Institute of Public Health. 120, 585-596.
Hellmann, J., Lesht, B., & Nadelhoffer, K. (2007). Chapter Four – Health. In Climate Change and Chicago: Projections and Potential Impacts. Retrieved from http://www.chicagoclimateaction.org/filebin/pdf/report/Chicago_climate_impacts_report_Chapter_Four_Health.pdf
Jentes, E. S., Davis, X. M., MacDonald, S., Snyman, P. J., Nelson, H., Quarry, D., . . . & Marano, N. (2010). Health risks and travel preparation among foreign visitors and expatriates during the 2008 Beijing Olympic and Paralympic Games. American Journal of Tropical Medical Hygene, 82, 466–472.
Lashof, D. A., & Patz, J. (2004). Heat advisory: How global warming causes more bad air days. Retrieved from http://www.nrdc.org/globalwarming/heatadvisory/heatadvisory.pdf.
McMichael, A. J. (2006) Population health as the ‘bottom-line’ of sustainability: A contemporary challenge for public health researchers. European Journal of Public Health, 16(6), 579–582.
McMichael, A. J., Woodruff, R. E., & Hales, S. (2006). Climate change and human health: Present and future risks. Lancet, 367, 859-869.
Patz, J. A., Campbell-Lendrum, D., Holloway, T., & Foley, J. A. (2005). Impact of regional climate change on human health. Nature, 438, 310-317.
Pauly, D., & Alder, J. (2005). Marine Fisheries Systems. In R. Hassan, R. Scholes, & N. Ash (eds.), Ecosystems and Human Well – being: Current State and Trends . (Vol. 1). Washington, D.C., Island Press.
Plantinga, A. J., & Bernell, S. (2007). The association between urban sprawl and obesity: Is it a two-way street?, Journal of Regional Science, 47(5), 857-879.
Rosenzweig, C., Parry, M. L., Fischer, G., & Frohberg, K. (1993). Climate change and world food supply. Research Report No. 3. Oxford, U.K. : Oxford University, Environmental Change Unit.
Wang, X., Westerdahl, D., Chen, L., Wu, Y., Hao, J., Pan, X., Guo, X., & Zhang, K. M. (2009). Evaluating the air quality impacts of the 2008 Beijing Olympic Games: On-road emission factors and black carbon profiles. Atmospheric Environment, 43, 4535–4543.
Wei, M., Kampert, J. B. , Barlow, C. E. , Nichaman, M. Z. , Gibbons, L. W., Paffenbarger, Jr., R. S., & Blair, S. N. (1999). Relationship between low cardiorespiratory fitness and mortality in normal-weight, overweight, and obese men. Journal of the American Medical Association, 282(16), 1547-1553.
World Health Organization. (2009). Climate change and human health. Fact sheet, July 2005. Retrieved from http://www.who.int/globalchange/news/fsclimandhealth/en/index.html.
Glossary
- Morbidity
- The relative frequency of occurrence of a disease.
- Mortality
- The number of deaths that occur at a specific time, in a specific group, or from a specific cause.
- Post-traumatic stress disorder
- PTSD – a psychological condition affecting people who have suffered severe emotional trauma as a result of an experience such as combat, crime, or natural disaster, and causing sleep disturbances, flashbacks, anxiety, tiredness, and depression.
- Volatile organic compounds
- (VOC – an organic compound that evaporates at a relatively low temperature and contributes to air pollution, e.g. ethylene, propylene, benzene, or styrene).
- Urban sprawl
- Any environment characterized by (1) a population widely dispersed in low density residential development; (2) rigid separation of homes, shops, and workplaces; (3) a lack of distinct, thriving activity centers, such as strong downtowns or suburban town centers; and (4) a network of roads marked by large block size and poor access from one place to another) has been found to correlate with increased body mass index.
Candela Citations
- Sustainability: A Comprehensive Foundation. Authored by: Tom Theis and Jonathan Tomkin, Editors.. Provided by: OpenStax CNX. Located at: http://cnx.org/contents/1741effd-9cda-4b2b-a91e-003e6f587263@44.1. License: CC BY: Attribution. License Terms: Download for free at http://cnx.org/contents/1741effd-9cda-4b2b-a91e-003e6f587263@44.1