Explain why conservation biology and biodiversity are important
In the 1980s, biologists working in Lake Victoria in Africa discovered one of the most extraordinary products of evolution on the planet. Located in the Great Rift Valley, Lake Victoria is a large lake about 68,900 km2 in area (larger than Lake Huron, the second largest of North America’s Great Lakes). Biologists were studying species of a family of fish called cichlids. They found that as they sampled for fish in different locations of the lake, they never stopped finding new species, and they identified nearly 500 evolved types of cichlids. But while studying these variations, they quickly discovered that the invasive Nile Perch was destroying the lake’s cichlid population, bringing hundreds of cichlid species to extinction with devastating rapidity.

Figure 1. Lake Victoria in Africa, shown in this satellite image, was the site of one of the most extraordinary evolutionary findings on the planet, as well as a casualty of devastating biodiversity loss. (credit: modification of work by Rishabh Tatiraju, using NASA World Wind software)
Learning Objectives
- Describe biodiversity and the different ways it may be assessed
- Identify historical and potential causes of high extinction rates
- Identify biodiversity components that support human life
- Identify significant threats to biodiversity
- Describe current biodiversity estimates
- Identify modern methods for preserving biodiversity
Biodiversity
Traditionally, ecologists have measured biodiversity, a general term for the variety present in the biosphere, by taking into account both the number of species and their commonness. Biodiversity can be estimated at a number of levels of organization of living things. These estimation indexes, which came from information theory, are most useful as a first step in quantifying biodiversity between and within ecosystems; they are less useful when the main concern among conservation biologists is simply the loss of biodiversity. However, biologists recognize that measures of biodiversity, in terms of species diversity, may help focus efforts to preserve the biologically or technologically important elements of biodiversity.
The Lake Victoria cichlids (Figure 2) provide an example through which we can begin to understand biodiversity. The biologists studying cichlids in the 1980s discovered hundreds of cichlid species representing a variety of specializations to particular habitat types and specific feeding strategies: eating plankton floating in the water, scraping and then eating algae from rocks, eating insect larvae from the bottom, and eating the eggs of other species of cichlid. The cichlids of Lake Victoria are the product of an adaptive radiation. An adaptive radiation is a rapid (less than three million years in the case of the Lake Victoria cichlids) branching through speciation of a phylogenetic tree into many closely related species; typically, the species “radiate” into different habitats and niches. The Galápagos finches are an example of a modest adaptive radiation with 15 species. The cichlids of Lake Victoria are an example of a spectacular adaptive radiation that includes about 500 species.

Figure 2. Both (a) Haplochromis nyererei and (b) Haplochromis vonlinnei are cichlids endemic to Lake Victoria. Haplochromis vonlinnei has not been seen in the lake for over two decades, and has likely gone extinct due to the presence of invasive species.
At the time biologists were making this discovery, some species began to quickly disappear. A culprit in these declines was a species of large fish that was introduced to Lake Victoria by fisheries to feed the people living around the lake. The Nile perch was introduced in 1963, but lay low until the 1980s when its populations began to surge. The Nile perch population grew by consuming cichlids, driving species after species to the point of extinction (the disappearance of a species). In fact, there were several factors that played a role in the extinction of perhaps 200 cichlid species in Lake Victoria: the Nile perch, declining lake water quality due to agriculture and land clearing on the shores of Lake Victoria, and increased fishing pressure. Scientists had not even catalogued all of the species present—so many were lost that were never named. The diversity is now a shadow of what it once was.
The cichlids of Lake Victoria are a thumbnail sketch of contemporary rapid species loss that occurs all over Earth and is caused by human activity. Extinction is a natural process of macroevolution that occurs at the rate of about one out of 1 million species becoming extinct per year. The fossil record reveals that there have been five periods of mass extinction in history with much higher rates of species loss, and the rate of species loss today is comparable to those periods of mass extinction. However, there is a major difference between the previous mass extinctions and the current extinction we are experiencing: human activity. Specifically, three human activities have a major impact: destruction of habitat, introduction of exotic species, and over-harvesting. Predictions of species loss within the next century, a tiny amount of time on geological timescales, range from 10 percent to 50 percent. Extinctions on this scale have only happened five other times in the history of the planet, and they have been caused by cataclysmic events that changed the course of the history of life in each instance. Earth is now in one of those times.
Types of Biodiversity
Scientists generally accept that the term biodiversity describes the number and kinds of species in a location or on the planet. Species can be difficult to define, but most biologists still feel comfortable with the concept and are able to identify and count eukaryotic species in most contexts. Biologists have also identified alternate measures of biodiversity, some of which are important for planning how to preserve biodiversity.
Genetic diversity is one of those alternate concepts. Genetic diversity or variation is the raw material for adaptation in a species. A species’ future potential for adaptation depends on the genetic diversity held in the genomes of the individuals in populations that make up the species. The same is true for higher taxonomic categories. A genus with very different types of species will have more genetic diversity than a genus with species that look alike and have similar ecologies. If there were a choice between one of these genera of species being preserved, the one with the greatest potential for subsequent evolution is the most genetically diverse one. It would be ideal not to have to make such choices, but increasingly this may be the norm.
Many genes code for proteins, which in turn carry out the metabolic processes that keep organisms alive and reproducing. Genetic diversity can be measured as chemical diversity in that different species produce a variety of chemicals in their cells, both the proteins as well as the products and byproducts of metabolism. This chemical diversity has potential benefit for humans as a source of pharmaceuticals, so it provides one way to measure diversity that is important to human health and welfare.
Humans have generated diversity in domestic animals, plants, and fungi. This diversity is also suffering losses because of migration, market forces, and increasing globalism in agriculture, especially in heavily populated regions such as China, India, and Japan. The human population directly depends on this diversity as a stable food source, and its decline is troubling biologists and agricultural scientists.
It is also useful to define ecosystem diversity, meaning the number of different ecosystems on the planet or in a given geographic area (Figure 3). Whole ecosystems can disappear even if some of the species might survive by adapting to other ecosystems. The loss of an ecosystem means the loss of interactions between species, the loss of unique features of coadaptation, and the loss of biological productivity that an ecosystem is able to create. An example of a largely extinct ecosystem in North America is the prairie ecosystem. Prairies once spanned central North America from the boreal forest in northern Canada down into Mexico. They are now all but gone, replaced by crop fields, pasture lands, and suburban sprawl. Many of the species survive, but the hugely productive ecosystem that was responsible for creating the most productive agricultural soils is now gone. As a consequence, soils are disappearing or must be maintained at greater expense.

Figure 3. The variety of ecosystems on Earth—from (a) coral reef to (b) prairie—enables a great diversity of species to exist. (credit a: modification of work by Jim Maragos, USFWS; credit b: modification of work by Jim Minnerath, USFWS)
Patterns of Biodiversity
Biodiversity is not evenly distributed on Earth. Lake Victoria contained almost 500 species of cichlids alone, ignoring the other fish families present in the lake. All of these species were found only in Lake Victoria; therefore, the 500 species of cichlids were endemic. Endemic species are found in only one location. Endemics with highly restricted distributions are particularly vulnerable to extinction. Higher taxonomic levels, such as genera and families, can also be endemic. Lake Huron contains about 79 species of fish, all of which are found in many other lakes in North America. What accounts for the difference in fish diversity in these two lakes? Lake Victoria is a tropical lake, while Lake Huron is a temperate lake. Lake Huron in its present form is only about 7,000 years old, while Lake Victoria in its present form is about 15,000 years old. Biogeographers have suggested these two factors, latitude and age, are two of several hypotheses to explain biodiversity patterns on the planet.
Biogeographer
Biogeography is the study of the distribution of the world’s species—both in the past and in the present. The work of biogeographers is critical to understanding our physical environment, how the environment affects species, and how environmental changes impact the distribution of a species; it has also been critical to developing evolutionary theory. Biogeographers need to understand both biology and ecology. They also need to be well-versed in evolutionary studies, soil science, and climatology.
There are three main fields of study under the heading of biogeography: ecological biogeography, historical biogeography (called paleobiogeography), and conservation biogeography. Ecological biogeography studies the current factors affecting the distribution of plants and animals. Historical biogeography, as the name implies, studies the past distribution of species. Conservation biogeography, on the other hand, is focused on the protection and restoration of species based upon known historical and current ecological information. Each of these fields considers both zoogeography and phytogeography—the past and present distribution of animals and plants.
One of the oldest observed patterns in ecology is that species biodiversity in almost every taxonomic group increases as latitude declines. In other words, biodiversity increases closer to the equator (Figure 4).

Figure 4. This map illustrates the number of amphibian species across the globe and shows the trend toward higher biodiversity at lower latitudes. A similar pattern is observed for most taxonomic groups.
It is not yet clear why biodiversity increases closer to the equator, but hypotheses include the greater age of the ecosystems in the tropics versus temperate regions that were largely devoid of life or drastically impoverished during the last glaciation. The idea is that greater age provides more time for speciation. Another possible explanation is the increased energy the tropics receive from the sun versus the decreased energy that temperate and polar regions receive. It is not entirely clear how greater energy input could translate into more species. The complexity of tropical ecosystems may promote speciation by increasing the heterogeneity, or number of ecological niches, in the tropics relative to higher latitudes. The greater heterogeneity provides more opportunities for coevolution, specialization, and perhaps greater selection pressures leading to population differentiation. However, this hypothesis suffers from some circularity—ecosystems with more species encourage speciation, but how did they get more species to begin with? The tropics have been perceived as being more stable than temperate regions, which have a pronounced climate and day-length seasonality. The tropics have their own forms of seasonality, such as rainfall, but they are generally assumed to be more stable environments and this stability might promote speciation.
Regardless of the mechanisms, it is certainly true that all levels of biodiversity are greatest in the tropics. Additionally, the rate of endemism is highest, and there are more biodiversity hotspots. However, this richness of diversity also means that knowledge of species is lowest, and there is a high potential for biodiversity loss.
Mass Extinctions
The number of species on the planet, or in any geographical area, is the result of an equilibrium of two evolutionary processes that are ongoing: speciation and extinction. Both are natural “birth” and “death” processes of macroevolution. When speciation rates begin to outstrip extinction rates, the number of species will increase; likewise, the number of species will decrease when extinction rates begin to overtake speciation rates. Throughout Earth’s history, these two processes have fluctuated—sometimes leading to dramatic changes in the number of species on Earth as reflected in the fossil record (Figure 5).
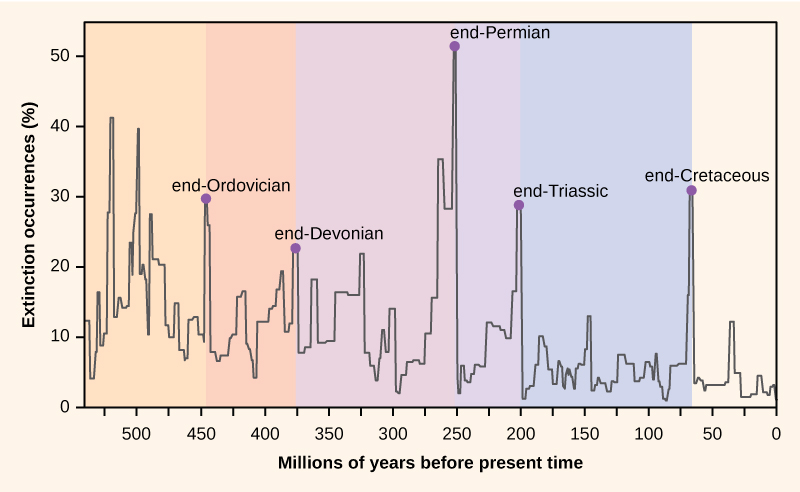
Figure 5. Percent extinction occurrences as reflected in the fossil record have fluctuated throughout Earth’s history. Sudden and dramatic losses of biodiversity, called mass extinctions, have occurred five times.
Paleontologists have identified five strata in the fossil record that appear to show sudden and dramatic (greater than half of all extant species disappearing from the fossil record) losses in biodiversity. These are called mass extinctions. There are many lesser, yet still dramatic, extinction events, but the five mass extinctions have attracted the most research. An argument can be made that the five mass extinctions are only the five most extreme events in a continuous series of large extinction events throughout the Phanerozoic (since 542 million years ago). In most cases, the hypothesized causes are still controversial; however, the most recent event seems clear.
Recorded Mass Extinctions
The fossil record of the mass extinctions was the basis for defining periods of geological history, so they typically occur at the transition point between geological periods. The transition in fossils from one period to another reflects the dramatic loss of species and the gradual origin of new species. These transitions can be seen in the rock strata. Table 1 provides data on the five mass extinctions.
| Table 1. Mass Extinctions | ||
|---|---|---|
| Geological Period | Mass Extinction Name | Time (millions of years ago) |
| Ordovician–Silurian | end-Ordovician O–S | 450–440 |
| Late Devonian | end-Devonian | 375–360 |
| Permian–Triassic | end-Permian | 251 |
| Triassic–Jurassic | end-Triassic | 205 |
| Cretaceous–Paleogene | end-Cretaceous K–Pg (K–T) | 65.5 |
The Ordovician-Silurian extinction event is the first recorded mass extinction and the second largest. During this period, about 85 percent of marine species (few species lived outside the oceans) became extinct. The main hypothesis for its cause is a period of glaciation and then warming. The extinction event actually consists of two extinction events separated by about 1 million years. The first event was caused by cooling, and the second event was due to the subsequent warming. The climate changes affected temperatures and sea levels. Some researchers have suggested that a gamma-ray burst, caused by a nearby supernova, is a possible cause of the Ordovician-Silurian extinction. The gamma-ray burst would have stripped away the Earth’s ozone layer causing intense ultraviolet radiation from the sun and may account for climate changes observed at the time. The hypothesis is speculative, but extraterrestrial influences on Earth’s history are an active line of research. Recovery of biodiversity after the mass extinction took from 5 to 20 million years, depending on the location.
The late Devonian extinction may have occurred over a relatively long period of time. It appears to have affected marine species and not the plants or animals inhabiting terrestrial habitats. The causes of this extinction are poorly understood.
The end-Permian extinction was the largest in the history of life. Indeed, an argument could be made that Earth nearly became devoid of life during this extinction event. The planet looked very different before and after this event. Estimates are that 96 percent of all marine species and 70 percent of all terrestrial species were lost. It was at this time, for example, that the trilobites, a group that survived the Ordovician–Silurian extinction, became extinct. The causes for this mass extinction are not clear, but the leading suspect is extended and widespread volcanic activity that led to a runaway global-warming event. The oceans became largely anoxic, suffocating marine life. Terrestrial tetrapod diversity took 30 million years to recover after the end-Permian extinction. The Permian extinction dramatically altered Earth’s biodiversity makeup and the course of evolution.
The causes of the Triassic–Jurassic extinction event are not clear and hypotheses of climate change, asteroid impact, and volcanic eruptions have been argued. The extinction event occurred just before the breakup of the supercontinent Pangaea, although recent scholarship suggests that the extinctions may have occurred more gradually throughout the Triassic.
The causes of the end-Cretaceous extinction event are the ones that are best understood. It was during this extinction event about 65 million years ago that the dinosaurs, the dominant vertebrate group for millions of years, disappeared from the planet (with the exception of a theropod clade that gave rise to birds). Indeed, every land animal that weighed more then 25 kg became extinct. The cause of this extinction is now understood to be the result of a cataclysmic impact of a large meteorite, or asteroid, off the coast of what is now the Yucatán Peninsula. This hypothesis, proposed first in 1980, was a radical explanation based on a sharp spike in the levels of iridium (which rains down from space in meteors at a fairly constant rate but is otherwise absent on Earth’s surface) at the rock stratum that marks the boundary between the Cretaceous and Paleogene periods (Figure 6). This boundary marked the disappearance of the dinosaurs in fossils as well as many other taxa. The researchers who discovered the iridium spike interpreted it as a rapid influx of iridium from space to the atmosphere (in the form of a large asteroid) rather than a slowing in the deposition of sediments during that period. It was a radical explanation, but the report of an appropriately aged and sized impact crater in 1991 made the hypothesis more believable. Now an abundance of geological evidence supports the theory. Recovery times for biodiversity after the end-Cretaceous extinction are shorter, in geological time, than for the end-Permian extinction, on the order of 10 million years.
Practice Question

Figure 6. Iridium band (credit: USGS)
In 1980, Luis and Walter Alvarez, Frank Asaro, and Helen Michels discovered, across the world, a spike in the concentration of iridium within the sedimentary layer at the K–Pg boundary. These researchers hypothesized that this iridium spike was caused by an asteroid impact that resulted in the K–Pg mass extinction. In Figure 6, the iridium layer is the light band.
Scientists measured the relative abundance of fern spores above and below the K–Pg boundary in this rock sample. Which of the following statements most likely represents their findings?
- An abundance of fern spores from several species was found below the K–Pg boundary, but none was found above.
- An abundance of fern spores from several species was found above the K–Pg boundary, but none was found below.
- An abundance of fern spores was found both above and below the K–Pg boundary, but only one species was found below the boundary, and many species were found above the boundary.
- Many species of fern spores were found both above and below the boundary, but the total number of spores was greater below the boundary.
The Pleistocene Extinction
The Pleistocene Extinction is one of the lesser extinctions, and a recent one. It is well known that the North American, and to some degree Eurasian, megafauna, or large animals, disappeared toward the end of the last glaciation period. The extinction appears to have happened in a relatively restricted time period of 10,000–12,000 years ago. In North America, the losses were quite dramatic and included the woolly mammoths (last dated about 4,000 years ago in an isolated population), mastodon, giant beavers, giant ground sloths, saber-toothed cats, and the North American camel, just to name a few. The possibility that the rapid extinction of these large animals was caused by over-hunting was first suggested in the 1900s. Research into this hypothesis continues today. It seems likely that over-hunting caused many pre-written history extinctions in many regions of the world.
In general, the timing of the Pleistocene extinctions correlated with the arrival of humans and not with climate-change events, which is the main competing hypothesis for these extinctions. The extinctions began in Australia about 40,000 to 50,000 years ago, just after the arrival of humans in the area: a marsupial lion, a giant one-ton wombat, and several giant kangaroo species disappeared. In North America, the extinctions of almost all of the large mammals occurred 10,000–12,000 years ago. All that are left are the smaller mammals such as bears, elk, moose, and cougars. Finally, on many remote oceanic islands, the extinctions of many species occurred coincident with human arrivals. Not all of the islands had large animals, but when there were large animals, they were lost. Madagascar was colonized about 2,000 years ago and the large mammals that lived there became extinct. Eurasia and Africa do not show this pattern, but they also did not experience a recent arrival of humans. Humans arrived in Eurasia hundreds of thousands of years ago after the origin of the species in Africa. This topic remains an area of active research and hypothesizing. It seems clear that even if climate played a role, in most cases human hunting precipitated the extinctions.
Present-Time Extinctions
The sixth, or Holocene, mass extinction appears to have begun earlier than previously believed and has mostly to do with the activities of Homo sapiens. Since the beginning of the Holocene period, there are numerous recent extinctions of individual species that are recorded in human writings. Most of these are coincident with the expansion of the European colonies since the 1500s.
One of the earlier and popularly known examples is the dodo bird. The dodo bird lived in the forests of Mauritius, an island in the Indian Ocean. The dodo bird became extinct around 1662. It was hunted for its meat by sailors and was easy prey because the dodo, which did not evolve with humans, would approach people without fear. Introduced pigs, rats, and dogs brought to the island by European ships also killed dodo young and eggs.
Steller’s sea cow became extinct in 1768; it was related to the manatee and probably once lived along the northwest coast of North America. Steller’s sea cow was first discovered by Europeans in 1741 and was hunted for meat and oil. The last sea cow was killed in 1768. That amounts to 27 years between the sea cow’s first contact with Europeans and extinction of the species.
In 1914, the last living passenger pigeon died in a zoo in Cincinnati, Ohio. This species had once darkened the skies of North America during its migrations, but it was hunted and suffered from habitat loss through the clearing of forests for farmland. In 1918, the last living Carolina parakeet died in captivity. This species was once common in the eastern United States, but it suffered from habitat loss. The species was also hunted because it ate orchard fruit when its native foods were destroyed to make way for farmland. The Japanese sea lion, which inhabited a broad area around Japan and the coast of Korea, became extinct in the 1950s due to fishermen. The Caribbean monk seal was distributed throughout the Caribbean Sea but was driven to extinction via hunting by 1952.
These are only a few of the recorded extinctions in the past 500 years. The International Union for Conservation of Nature (IUCN) keeps a list of extinct and endangered species called the Red List. The list is not complete, but it describes 380 extinct species of vertebrates after 1500 AD, 86 of which were driven extinct by overhunting or overfishing.
Estimates of Present-Time Extinction Rates
Estimates of extinction rates are hampered by the fact that most extinctions are probably happening without observation. The extinction of a bird or mammal is likely to be noticed by humans, especially if it has been hunted or used in some other way. But there are many organisms that are of less interest to humans (not necessarily of less value) and many that are undescribed.
The background extinction rate is estimated to be about one per million species per year (E/MSY). For example, assuming there are about ten million species in existence, the expectation is that ten species would become extinct each year (each year represents ten million species per year).
One contemporary extinction rate estimate uses the extinctions in the written record since the year 1500. For birds alone this method yields an estimate of 26 E/MSY. However, this value may be underestimated for three reasons. First, many species would not have been described until much later in the time period, so their loss would have gone unnoticed. Second, the number of recently extinct species is increasing because extinct species now are being described from skeletal remains. And third, some species are probably already extinct even though conservationists are reluctant to name them as such. Taking these factors into account raises the estimated extinction rate closer to 100 E/MSY. The predicted rate by the end of the century is 1500 E/MSY.

Figure 7. Studies have shown that the number of species present increases with the size of the habitat. (credit: modification of work by Adam B. Smith)
A second approach to estimating present-time extinction rates is to correlate species loss with habitat loss by measuring forest-area loss and understanding species-area relationships. The species-area relationship is the rate at which new species are seen when the area surveyed is increased. Studies have shown that the number of species present increases as the size of the island increases. This phenomenon has also been shown to hold true in other habitats as well. Turning this relationship around, if the habitat area is reduced, the number of species living there will also decline. Estimates of extinction rates based on habitat loss and species-area relationships have suggested that with about 90 percent habitat loss an expected 50 percent of species would become extinct. Species-area estimates have led to species extinction rate calculations of about 1000 E/MSY and higher. In general, actual observations do not show this amount of loss and suggestions have been made that there is a delay in extinction. Recent work has also called into question the applicability of the species-area relationship when estimating the loss of species. This work argues that the species-area relationship leads to an overestimate of extinction rates. A better relationship to use may be the endemics-area relationship. Using this method would bring estimates down to around 500 E/MSY in the coming century. Note that this value is still 500 times the background rate.
The Importance of Biodiversity to Human Life
It may not be clear why biologists are concerned about biodiversity loss. When biodiversity loss is thought of as the extinction of the passenger pigeon, the dodo bird, and even the woolly mammoth, the loss may appear to be an emotional one. But is the loss practically important for the welfare of the human species? From the perspective of evolution and ecology, the loss of a particular individual species is unimportant (however, the loss of a keystone species can lead to ecological disaster). Extinction is a normal part of macroevolution. But the accelerated extinction rate means the loss of tens of thousands of species within our lifetimes, and it is likely to have dramatic effects on human welfare through the collapse of ecosystems and in added costs to maintain food production, clean air and water, and human health.
Agriculture began after early hunter-gatherer societies first settled in one place and heavily modified their immediate environment. This cultural transition has made it difficult for humans to recognize their dependence on undomesticated living things on the planet. Biologists recognize the human species is embedded in ecosystems and is dependent on them, just as every other species on the planet is dependent. Technology smoothes out the extremes of existence, but ultimately the human species cannot exist without its ecosystem.
Human Health
Contemporary societies that live close to the land often have a broad knowledge of the medicinal uses of plants growing in their area. Most plants produce secondary plant compounds, which are toxins used to protect the plant from insects and other animals that eat them, but some of which also work as medication. For centuries in Europe, older knowledge about the medical uses of plants was compiled in herbals—books that identified plants and their uses. Humans are not the only species to use plants for medicinal reasons: the great apes, orangutans, chimpanzees, bonobos, and gorillas have all been observed self-medicating with plants.

Figure 8. Catharanthus roseus, the Madagascar periwinkle, has various medicinal properties. Among other uses, it is a source of vincristine, a drug used in the treatment of lymphomas. (credit: Forest and Kim Starr)
Modern pharmaceutical science also recognizes the importance of these plant compounds. Examples of significant medicines derived from plant compounds include aspirin, codeine, digoxin, atropine, and vincristine (Figure 8). Many medicines were once derived from plant extracts but are now synthesized. It is estimated that, at one time, 25 percent of modern drugs contained at least one plant extract. That number has probably decreased to about 10 percent as natural plant ingredients are replaced by synthetic versions. Antibiotics, which are responsible for extraordinary improvements in health and lifespans in developed countries, are compounds largely derived from fungi and bacteria.
In recent years, animal venoms and poisons have excited intense research for their medicinal potential. By 2007, the FDA had approved five drugs based on animal toxins to treat diseases such as hypertension, chronic pain, and diabetes. Another five drugs are undergoing clinical trials, and at least six drugs are being used in other countries. Other toxins under investigation come from mammals, snakes, lizards, various amphibians, fish, snails, octopuses, and scorpions.
Aside from representing billions of dollars in profits, these medicines improve people’s lives. Pharmaceutical companies are actively looking for new compounds synthesized by living organisms that can function as medicine. It is estimated that 1/3 of pharmaceutical research and development is spent on natural compounds and that about 35 percent of new drugs brought to market between 1981 and 2002 were from natural compounds. The opportunities for new medications will be reduced in direct proportion to the disappearance of species.
Agricultural Diversity
Since the beginning of human agriculture more than 10,000 years ago, human groups have been breeding and selecting crop varieties. This crop diversity matched the cultural diversity of highly subdivided populations of humans. For example, potatoes were domesticated beginning around 7,000 years ago in the central Andes of Peru and Bolivia. The potatoes grown in that region belong to seven species and the number of varieties likely is in the thousands. Each variety has been bred to thrive at particular elevations and soil and climate conditions. The diversity is driven by the diverse demands of the topography, the limited movement of people, and the demands created by crop rotation for different varieties that will do well in different fields.
Potatoes are only one example of human-generated diversity. Every plant, animal, and fungus that has been cultivated by humans has been bred from original wild ancestor species into diverse varieties arising from the demands for food value, adaptation to growing conditions, and resistance to pests. The potato demonstrates a well-known example of the risks of low crop diversity: the tragic Irish potato famine when the single variety grown in Ireland became susceptible to a potato blight, wiping out the crop. The loss of the crop led to famine, death, and mass emigration. Resistance to disease is a chief benefit to maintaining crop biodiversity, and lack of diversity in contemporary crop species carries similar risks. Seed companies, which are the source of most crop varieties in developed countries, must continually breed new varieties to keep up with evolving pest organisms. These same seed companies, however, have participated in the decline of the number of varieties available as they focus on selling fewer varieties in more areas of the world.

Figure 9. The Svalbard Global Seed Vault is a storage facility for seeds of Earth’s diverse crops. (credit: Mari Tefre, Svalbard Global Seed Vault)
The ability to create new crop varieties relies on the diversity of varieties available and the accessibility of wild forms related to the crop plant. These wild forms are often the source of new gene variants that can be bred with existing varieties to create varieties with new attributes. Loss of wild species related to a crop will mean the loss of potential in crop improvement. Maintaining the genetic diversity of wild species related to domesticated species ensures our continued food supply.
Since the 1920s, government agriculture departments have maintained seed banks of crop varieties as a way to maintain crop diversity. This system has flaws because, over time, seed banks are lost through accidents, and there is no way to replace them. In 2008, the Svalbard Global Seed Vault (Figure 9) began storing seeds from around the world as a backup system to the regional seed banks. If a regional seed bank stores varieties in Svalbard, losses can be replaced from Svalbard.
The seed vault is located deep into the rock of an arctic island. Conditions within the vault are maintained at ideal temperature and humidity for seed survival, but the deep underground location of the vault in the arctic means that failure of the vault’s systems will not compromise the climatic conditions inside the vault.
Practice Question
The Svalbard Global Seed Vault is located on Spitsbergen island in Norway, which has an arctic climate. Why might an arctic climate be good for seed storage?
Crop success s is largely dependent on the quality of the soil. Although some agricultural soils are rendered sterile using controversial cultivation and chemical treatments, most contain a huge diversity of organisms that maintain nutrient cycles—breaking down organic matter into nutrient compounds that crops need for growth. These organisms also maintain soil texture that affects water and oxygen dynamics in the soil that are necessary for plant growth. If farmers had to maintain arable soil using alternate means, the cost of food would be much higher than it is now. These kinds of processes are called ecosystem services. They occur within ecosystems, such as soil ecosystems, as a result of the diverse metabolic activities of the organisms living there, but they provide benefits to human food production, drinking water availability, and breathable air.
Other key ecosystem services related to food production are plant pollination and crop pest control. Over 150 crops in the United States require pollination to produce. One estimate of the benefit of honeybee pollination within the United States is $1.6 billion per year; other pollinators contribute up to $6.7 billion more.
Many honeybee populations are managed by apiarists who rent out their hives’ services to farmers. Honeybee populations in North America have been suffering large losses caused by a syndrome known as colony collapse disorder, whose cause is unclear. Other pollinators include a diverse array of other bee species and various insects and birds. Loss of these species would make growing crops requiring pollination impossible, increasing dependence on other crops.
Finally, humans compete for their food with crop pests, most of which are insects. Pesticides control these competitors; however, pesticides are costly and lose their effectiveness over time as pest populations adapt. They also lead to collateral damage by killing non-pest species and risking the health of consumers and agricultural workers. Ecologists believe that the bulk of the work in removing pests is actually done by predators and parasites of those pests, but the impact has not been well studied. A review found that in 74 percent of studies that looked for an effect of landscape complexity on natural enemies of pests, the greater the complexity, the greater the effect of pest-suppressing organisms. An experimental study found that introducing multiple enemies of pea aphids (an important alfalfa pest) increased the yield of alfalfa significantly. This study shows the importance of landscape diversity via the question of whether a diversity of pests is more effective at control than one single pest; the results showed this to be the case. Loss of diversity in pest enemies will inevitably make it more difficult and costly to grow food.
Wild Food Sources
In addition to growing crops and raising animals for food, humans obtain food resources from wild populations, primarily fish populations. For approximately 1 billion people, aquatic resources provide the main source of animal protein. But since 1990, global fish production has declined. Despite considerable effort, few fisheries on the planet are managed for sustainability.
Fishery extinctions rarely lead to complete extinction of the harvested species, but rather to a radical restructuring of the marine ecosystem in which a dominant species is so over-harvested that it becomes a minor player, ecologically. In addition to humans losing the food source, these alterations affect many other species in ways that are difficult or impossible to predict. The collapse of fisheries has dramatic and long-lasting effects on local populations that work in the fishery. In addition, the loss of an inexpensive protein source to populations that cannot afford to replace it will increase the cost of living and limit societies in other ways. In general, the fish taken from fisheries have shifted to smaller species as larger species are fished to extinction. The ultimate outcome could clearly be the loss of aquatic systems as food sources.
Psychological and Moral Value
Finally, it has been argued that humans benefit psychologically from living in a biodiverse world. A chief proponent of this idea is entomologist E. O. Wilson. He argues that human evolutionary history has adapted us to live in a natural environment and that built environments generate stressors that affect human health and well-being. There is considerable research into the psychological regenerative benefits of natural landscapes that suggests the hypothesis may hold some truth. In addition, there is a moral argument that humans have a responsibility to inflict as little harm as possible on other species.
Threats to Biodiversity
The core threat to biodiversity on the planet, and therefore a threat to human welfare, is the combination of human population growth and resource exploitation. The human population requires resources to survive and grow, and those resources are being removed unsustainably from the environment. The three greatest proximate threats to biodiversity are habitat loss, overharvesting, and introduction of exotic species. The first two of these are a direct result of human population growth and resource use. The third results from increased mobility and trade. A fourth major cause of extinction, anthropogenic climate change, has not yet had a large impact, but it is predicted to become significant during this century. Global climate change is also a consequence of human population needs for energy and the use of fossil fuels to meet those needs (Figure 10). Environmental issues, such as toxic pollution, have specific targeted effects on species, but they are not generally seen as threats at the magnitude of the others.

Figure 10. Atmospheric carbon dioxide levels fluctuate in a cyclical manner. However, the burning of fossil fuels in recent history has caused a dramatic increase in the levels of carbon dioxide in the Earth’s atmosphere, which have now reached levels never before seen in human history. Scientists predict that the addition of this “greenhouse gas” to the atmosphere is resulting in climate change that will significantly impact biodiversity in the coming century.
Habitat Loss
Humans rely on technology to modify their environment and replace certain functions that were once performed by the natural ecosystem. Other species cannot do this. Elimination of their ecosystem—whether it is a forest, a desert, a grassland, a freshwater estuarine, or a marine environment—will kill the individuals in the species. Remove the entire habitat within the range of a species and, unless they are one of the few species that do well in human-built environments, the species will become extinct. Human destruction of habitats accelerated in the latter half of the twentieth century. Consider the exceptional biodiversity of Sumatra: it is home to one species of orangutan, a species of critically endangered elephant, and the Sumatran tiger, but half of Sumatra’s forest is now gone. The neighboring island of Borneo, home to the other species of orangutan, has lost a similar area of forest. Forest loss continues in protected areas of Borneo. The orangutan in Borneo is listed as endangered by the International Union for Conservation of Nature (IUCN), but it is simply the most visible of thousands of species that will not survive the disappearance of the forests of Borneo. The forests are removed for timber and to plant palm oil plantations (Figure 11). Palm oil is used in many products including food products, cosmetics, and biodiesel in Europe. A five-year estimate of global forest cover loss for the years 2000–2005 was 3.1 percent. In the humid tropics where forest loss is primarily from timber extraction, 272,000 km2 was lost out of a global total of 11,564,000 km2 (or 2.4 percent). In the tropics, these losses certainly also represent the extinction of species because of high levels of endemism.

Figure 11. (a) One species of orangutan, Pongo pygmaeus, is found only in the rainforests of Borneo, and the other species of orangutan (Pongo abelii) is found only in the rainforests of Sumatra. These animals are examples of the exceptional biodiversity of (c) the islands of Sumatra and Borneo. Other species include the (b) Sumatran tiger (Panthera tigris sumatrae) and the (d) Sumatran elephant (Elephas maximus sumatranus), both critically endangered species. Rainforest habitat is being removed to make way for (e) oil palm plantations such as this one in Borneo’s Sabah Province. (credit a: modification of work by Thorsten Bachner; credit b: modification of work by Dick Mudde; credit c: modification of work by U.S. CIA World Factbook; credit d: modification of work by “Nonprofit Organizations”/Flickr; credit e: modification of work by Dr. Lian Pin Koh)
Preventing Habitat Destruction with Wise Wood Choices
Most consumers do not imagine that the home improvement products they buy might be contributing to habitat loss and species extinctions. Yet the market for illegally harvested tropical timber is huge, and the wood products often find themselves in building supply stores in the United States. One estimate is that 10 percent of the imported timber stream in the United States, which is the world’s largest consumer of wood products, is potentially illegally logged. In 2006, this amounted to $3.6 billion in wood products. Most of the illegal products are imported from countries that act as intermediaries and are not the originators of the wood.
How is it possible to determine if a wood product, such as flooring, was harvested sustainably or even legally? The Forest Stewardship Council (FSC) certifies sustainably harvested forest products, therefore, looking for their certification on flooring and other hardwood products is one way to ensure that the wood has not been taken illegally from a tropical forest. Certification applies to specific products, not to a producer; some producers’ products may not have certification while other products are certified. While there are other industry-backed certifications other than the FSC, these are unreliable due to lack of independence from the industry. Another approach is to buy domestic wood species. While it would be great if there was a list of legal versus illegal wood products, it is not that simple. Logging and forest management laws vary from country to country; what is illegal in one country may be legal in another. Where and how a product is harvested and whether the forest from which it comes is being maintained sustainably all factor into whether a wood product will be certified by the FSC. It is always a good idea to ask questions about where a wood product came from and how the supplier knows that it was harvested legally.
Habitat destruction can affect ecosystems other than forests. Rivers and streams are important ecosystems and are frequently modified through land development and from damming or water removal. Damming of rivers affects the water flow and access to all parts of a river. Differing flow regimes can reduce or eliminate populations that are adapted to these changes in flow patterns. For example, an estimated 91percent of river lengths in the United States have been developed: they have modifications like dams, to create energy or store water; levees, to prevent flooding; or dredging or rerouting, to create land that is more suitable for human development. Many fish species in the United States, especially rare species or species with restricted distributions, have seen declines caused by river damming and habitat loss. Research has confirmed that species of amphibians that must carry out parts of their life cycles in both aquatic and terrestrial habitats have a greater chance of suffering population declines and extinction because of the increased likelihood that one of their habitats or access between them will be lost.
Overharvesting
Overharvesting is a serious threat to many species, but particularly to aquatic species. There are many examples of regulated commercial fisheries monitored by fisheries scientists that have nevertheless collapsed. The western Atlantic cod fishery is the most spectacular recent collapse. While it was a hugely productive fishery for 400 years, the introduction of modern factory trawlers in the 1980s and the pressure on the fishery led to it becoming unsustainable. The causes of fishery collapse are both economic and political in nature. Most fisheries are managed as a common (shared) resource even when the fishing territory lies within a country’s territorial waters. Common resources are subject to an economic pressure known as the tragedy of the commons in which essentially no fisher has a motivation to exercise restraint in harvesting a fishery when it is not owned by that fisher. The natural outcome of harvests of resources held in common is their overexploitation. While large fisheries are regulated to attempt to avoid this pressure, it still exists in the background. This overexploitation is exacerbated when access to the fishery is open and unregulated and when technology gives fishers the ability to overfish. In a few fisheries, the biological growth of the resource is less than the potential growth of the profits made from fishing if that time and money were invested elsewhere. In these cases—whales are an example—economic forces will always drive toward fishing the population to extinction.
For the most part, fishery extinction is not equivalent to biological extinction—the last fish of a species is rarely fished out of the ocean. At the same time, fishery extinction is still harmful to fish species and their ecosystems. There are some instances in which true extinction is a possibility. Whales have slow-growing populations and are at risk of complete extinction through hunting. There are some species of sharks with restricted distributions that are at risk of extinction. The groupers are another population of generally slow-growing fishes that, in the Caribbean, includes a number of species that are at risk of extinction from overfishing.
Coral reefs are extremely diverse marine ecosystems that face peril from several processes. Reefs are home to 1/3 of the world’s marine fish species—about 4,000 species—despite making up only 1 percent of marine habitat. Most home marine aquaria are stocked with wild-caught organisms, not cultured organisms. Although no species is known to have been driven extinct by the pet trade in marine species, there are studies showing that populations of some species have declined in response to harvesting, indicating that the harvest is not sustainable at those levels. There are concerns about the effect of the pet trade on some terrestrial species such as turtles, amphibians, birds, plants, and even the orangutan.
Bush meat is the generic term used for wild animals killed for food. Hunting is practiced throughout the world, but hunting practices, particularly in equatorial Africa and parts of Asia, are believed to threaten several species with extinction. Traditionally, bush meat in Africa was hunted to feed families directly; however, recent commercialization of the practice now has bush meat available in grocery stores, which has increased harvest rates to the level of unsustainability. Additionally, human population growth has increased the need for protein foods that are not being met from agriculture. Species threatened by the bush meat trade are mostly mammals including many primates living in the Congo basin.
Exotic Species
Exotic species are species that have been intentionally or unintentionally introduced by humans into an ecosystem in which they did not evolve. Such introductions likely occur frequently as natural phenomena. For example, Kudzu (Pueraria lobata), which is native to Japan, was introduced in the United States in 1876. It was later planted for soil conservation. Problematically, it grows too well in the southeastern United States—up to a foot a day. It is now a pest species and covers over 7 million acres in the southeastern United States. If an introduced species is able to survive in its new habitat, that introduction is now reflected in the observed range of the species. Human transportation of people and goods, including the intentional transport of organisms for trade, has dramatically increased the introduction of species into new ecosystems, sometimes at distances that are well beyond the capacity of the species to ever travel itself and outside the range of the species’ natural predators.
Most exotic species introductions probably fail because of the low number of individuals introduced or poor adaptation to the ecosystem they enter. Some species, however, possess preadaptations that can make them especially successful in a new ecosystem. These exotic species often undergo dramatic population increases in their new habitat and reset the ecological conditions in the new environment, threatening the species that exist there. For this reason, exotic species are also called invasive species. Exotic species can threaten other species through competition for resources, predation, or disease.

Figure 12. The brown tree snake, Boiga irregularis, is an exotic species that has caused numerous extinctions on the island of Guam since its accidental introduction in 1950. (credit: NPS)
Lakes and islands are particularly vulnerable to extinction threats from introduced species. In Lake Victoria, as mentioned earlier, the intentional introduction of the Nile perch was largely responsible for the extinction of about 200 species of cichlids. The accidental introduction of the brown tree snake via aircraft (Figure 12) from the Solomon Islands to Guam in 1950 has led to the extinction of three species of birds and three to five species of reptiles endemic to the island. Several other species are still threatened.
The brown tree snake is adept at exploiting human transportation as a means to migrate; one was even found on an aircraft arriving in Corpus Christi, Texas. Constant vigilance on the part of airport, military, and commercial aircraft personnel is required to prevent the snake from moving from Guam to other islands in the Pacific, especially Hawaii. Islands do not make up a large area of land on the globe, but they do contain a disproportionate number of endemic species because of their isolation from mainland ancestors.

Figure 13. This Limosa Harlequin Frog (Atelopus limosus), an endangered species from Panama, died from a fungal disease called chytridiomycosis. The red lesions are symptomatic of the disease. (credit: Brian Gratwicke)
It now appears that the global decline in amphibian species recognized in the 1990s is, in some part, caused by the fungus Batrachochytrium dendrobatidis, which causes the disease chytridiomycosis (Figure 13). There is evidence that the fungus is native to Africa and may have been spread throughout the world by transport of a commonly used laboratory and pet species: the African clawed toad (Xenopus laevis). It may well be that biologists themselves are responsible for spreading this disease worldwide. The North American bullfrog, Rana catesbeiana, which has also been widely introduced as a food animal but which easily escapes captivity, survives most infections of Batrachochytrium dendrobatidis and can act as a reservoir for the disease.
Early evidence suggests that another fungal pathogen, Geomyces destructans, introduced from Europe is responsible for white-nose syndrome, which infects cave-hibernating bats in eastern North America and has spread from a point of origin in western New York State (Figure 14). The disease has decimated bat populations and threatens extinction of species already listed as endangered: the Indiana bat, Myotis sodalis, and potentially the Virginia big-eared bat, Corynorhinus townsendii virginianus. How the fungus was introduced is unclear, but one logical presumption would be that recreational cavers unintentionally brought the fungus on clothes or equipment from Europe.

Figure 14. This little brown bat in Greeley Mine, Vermont, March 26, 2009, was found to have white-nose syndrome. (credit: Marvin Moriarty, USFWS)
Current Biodiversity
Despite considerable effort, knowledge of the species that inhabit the planet is limited. A recent estimate suggests that the eukaryote species for which science has names, about 1.5 million species, account for less than 20 percent of the total number of eukaryote species present on the planet (8.7 million species, by one estimate). Estimates of numbers of prokaryotic species are largely guesses, but biologists agree that science has only begun to catalog their diversity. Even with what is known, there is no central repository of names or samples of the described species; therefore, there is no way to be sure that the 1.5 million descriptions is an accurate number. It is a best guess based on the opinions of experts in different taxonomic groups. Given that Earth is losing species at an accelerating pace, science is very much in the place it was with the Lake Victoria cichlids: knowing little about what is being lost. Table 2 presents recent estimates of biodiversity in different groups.
| Table 2. Estimates of the Numbers of Described and Predicted Species by Taxonomic Group | ||||||
|---|---|---|---|---|---|---|
| Mora et al. 2011[1] | Chapman 2009[2] | Groombridge & Jenkins 2002[3] | ||||
| Described | Predicted | Described | Predicted | Described | Predicted | |
| Animalia | 1,124,516 | 9,920,000 | 1,424,153 | 6,836,330 | 1,225,500 | 10,820,000 |
| Chromista | 17,892 | 34,900 | 25,044 | 200,500 | — | — |
| Fungi | 44,368 | 616,320 | 98,998 | 1,500,000 | 72,000 | 1,500,000 |
| Plantae | 224,244 | 314,600 | 310,129 | 390,800 | 270,000 | 320,000 |
| Protozoa | 16,236 | 72,800 | 28,871 | 1,000,000 | 80,000 | 600,000 |
| Prokaryotes | — | — | 10,307 | 1,000,000 | 10,175 | — |
| Total | 1,438,769 | 10,960,000 | 1,897,502 | 10,897,630 | 1,657,675 | 13,240,000 |
There are various initiatives to catalog described species in accessible ways, and the internet is facilitating that effort. Nevertheless, it has been pointed out that at the current rate of species description, which according to the State of Observed Species Report is 17,000 to 20,000 new species per year, it will take close to 500 years to finish describing life on this planet.[4] Over time, the task becomes both increasingly impossible and increasingly easier as extinction removes species from the planet.
Naming and counting species may seem an unimportant pursuit given the other needs of humanity, but it is not simply an accounting. Describing species is a complex process by which biologists determine an organism’s unique characteristics and whether or not that organism belongs to any other described species. It allows biologists to find and recognize the species after the initial discovery, and allows them to follow up on questions about its biology. In addition, the unique characteristics of each species make it potentially valuable to humans or other species on which humans depend. Understanding these characteristics is the value of finding and naming species.
In 1988, British environmentalist Norman Myers developed a conservation concept to identify areas rich in species and at significant risk for species loss: biodiversity hotspots. Biodiversity hotspots are geographical areas that contain high numbers of endemic species. The purpose of the concept was to identify important locations on the planet for conservation efforts, a kind of conservation triage. By protecting hotspots, governments are able to protect a larger number of species. The original criteria for a hotspot included the presence of 1500 or more endemic plant species and 70 percent of the area disturbed by human activity. There are now 34 biodiversity hotspots (Figure 15) containing large numbers of endemic species, which include half of Earth’s endemic plants.
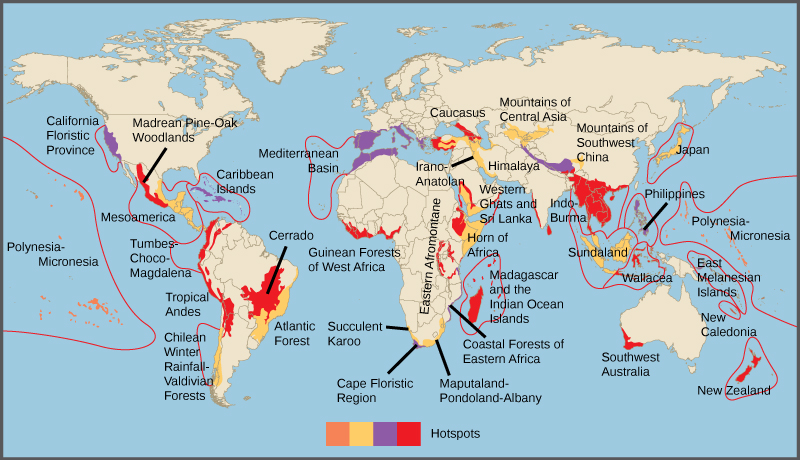
Figure 15. Conservation International has identified 34 biodiversity hotspots, which cover only 2.3 percent of the Earth’s surface but have endemic to them 42 percent of the terrestrial vertebrate species and 50 percent of the world’s plants.
Conservation and Restoration
This video takes a look at the growing fields of conservation biology and restoration ecology, which apply ecological principles to protecting ecosystems and to cleaning up the messes that we’ve already made.
Preserving Biodiversity
Preserving biodiversity is an extraordinary challenge that must be met by greater understanding of biodiversity itself, changes in human behavior and beliefs, and various preservation strategies.
Measuring Biodiversity
The technology of molecular genetics and data processing and storage are maturing to the point where cataloguing the planet’s species in an accessible way is close to feasible. DNA barcoding is one molecular genetic method, which takes advantage of rapid evolution in a mitochondrial gene present in eukaryotes, excepting the plants, to identify species using the sequence of portions of the gene. Plants may be barcoded using a combination of chloroplast genes. Rapid mass sequencing machines make the molecular genetics portion of the work relatively inexpensive and quick. Computer resources store and make available the large volumes of data. Projects are currently underway to use DNA barcoding to catalog museum specimens, which have already been named and studied, as well as testing the method on less studied groups. As of mid 2012, close to 150,000 named species had been barcoded. Early studies suggest there are significant numbers of undescribed species that looked too much like sibling species to previously be recognized as different. These now can be identified with DNA barcoding.
Numerous computer databases now provide information about named species and a framework for adding new species. However, as already noted, at the present rate of description of new species, it will take close to 500 years before the complete catalog of life is known. Many, perhaps most, species on the planet do not have that much time.
There is also the problem of understanding which species known to science are threatened and to what degree they are threatened. This task is carried out by the non-profit IUCN which, as previously mentioned, maintains the Red List—an online listing of endangered species categorized by taxonomy, type of threat, and other criteria (Figure 16). The Red List is supported by scientific research. In 2011, the list contained 61,000 species, all with supporting documentation.
Practice Question
Which of the following statements is not supported by this graph?

Figure 16. This chart shows the percentage of various animal species, by group, on the IUCN Red List as of 2007.
- There are more vulnerable fishes than critically endangered and endangered fishes combined.
- There are more critically endangered amphibians than vulnerable, endangered and critically endangered reptiles combined.
- Within each group, there are more critically endangered species than vulnerable species.
- A greater percentage of bird species are critically endangered than mollusk species.
Changing Human Behavior
Legislation throughout the world has been enacted to protect species. The legislation includes international treaties as well as national and state laws. The Convention on International Trade in Endangered Species of Wild Fauna and Flora (CITES) treaty came into force in 1975. The treaty, and the national legislation that supports it, provides a legal framework for preventing approximately 33,000 listed species from being transported across nations’ borders, thus protecting them from being caught or killed when international trade is involved. The treaty is limited in its reach because it only deals with international movement of organisms or their parts. It is also limited by various countries’ ability or willingness to enforce the treaty and supporting legislation. The illegal trade in organisms and their parts is probably a market in the hundreds of millions of dollars. Illegal wildlife trade is monitored by another non-profit: Trade Records Analysis of Flora and Fauna in Commerce (TRAFFIC).
Within many countries there are laws that protect endangered species and regulate hunting and fishing. In the United States, the Endangered Species Act (ESA) was enacted in 1973. Species at risk are listed by the Act; the U.S. Fish & Wildlife Service is required by law to develop management plans that protect the listed species and bring them back to sustainable numbers. The Act, and others like it in other countries, is a useful tool, but it suffers because it is often difficult to get a species listed, or to get an effective management plan in place once it is listed. Additionally, species may be controversially taken off the list without necessarily having had a change in their situation. More fundamentally, the approach to protecting individual species rather than entire ecosystems is both inefficient and focuses efforts on a few highly visible and often charismatic species, perhaps at the expense of other species that go unprotected. At the same time, the Act has a critical habitat provision outlined in the recovery mechanism that may benefit species other than the one targeted for management.
The Migratory Bird Treaty Act (MBTA) is an agreement between the United States and Canada that was signed into law in 1918 in response to declines in North American bird species caused by hunting. The Act now lists over 800 protected species. It makes it illegal to disturb or kill the protected species or distribute their parts (much of the hunting of birds in the past was for their feathers).
The international response to global warming has been mixed. The Kyoto Protocol, an international agreement that came out of the United Nations Framework Convention on Climate Change that committed countries to reducing greenhouse gas emissions by 2012, was ratified by some countries, but spurned by others. Two important countries in terms of their potential impact that did not ratify the Kyoto Protocol were the United States and China. The United States rejected it as a result of a powerful fossil fuel industry and China because of a concern it would stifle the nation’s growth. Some goals for reduction in greenhouse gasses were met and exceeded by individual countries, but worldwide, the effort to limit greenhouse gas production is not succeeding. The intended replacement for the Kyoto Protocol has not materialized because governments cannot agree on timelines and benchmarks. Meanwhile, climate scientists predict the resulting costs to human societies and biodiversity will be high.
As already mentioned, the private non-profit sector plays a large role in the conservation effort both in North America and around the world. The approaches range from species-specific organizations to the broadly focused IUCN and TRAFFIC. The Nature Conservancy takes a novel approach. It purchases land and protects it in an attempt to set up preserves for ecosystems. Ultimately, human behavior will change when human values change. At present, the growing urbanization of the human population is a force that poses challenges to the valuing of biodiversity.
Conservation in Preserves
Establishment of wildlife and ecosystem preserves is one of the key tools in conservation efforts. A preserve is an area of land set aside with varying degrees of protection for the organisms that exist within the boundaries of the preserve. Preserves can be effective in the short term for protecting both species and ecosystems, but they face challenges that scientists are still exploring to strengthen their viability as long-term solutions.
How Much Area to Preserve?
Due to the way protected lands are allocated (they tend to contain less economically valuable resources rather than being set aside specifically for the species or ecosystems at risk) and the way biodiversity is distributed, determining a target percentage of land or marine habitat that should be protected to maintain biodiversity levels is challenging. The IUCN World Parks Congress estimated that 11.5 percent of Earth’s land surface was covered by preserves of various kinds in 2003. This area is greater than previous goals; however, it only represents 9 out of 14 recognized major biomes. Research has shown that 12 percent of all species live only outside preserves; these percentages are much higher when only threatened species and high quality preserves are considered. For example, high quality preserves include only about 50 percent of threatened amphibian species. The conclusion must be that either the percentage of area protected must increase, or the percentage of high quality preserves must increase, or preserves must be targeted with greater attention to biodiversity protection. Researchers argue that more attention to the latter solution is required.
Preserve Design
There has been extensive research into optimal preserve designs for maintaining biodiversity. The fundamental principle behind much of the research has been the seminal theoretical work of Robert H. MacArthur and Edward O. Wilson published in 1967 on island biogeography.[5] This work sought to understand the factors affecting biodiversity on islands. The fundamental conclusion was that biodiversity on an island was a function of the origin of species through migration, speciation, and extinction on that island. Islands farther from a mainland are harder to get to, so migration is lower and the equilibrium number of species is lower. Within island populations, evidence suggests that the number of species gradually increases to a level similar to the numbers on the mainland from which the species is suspected to have migrated. In addition, smaller islands are harder to find, so their immigration rates for new species are lower. Smaller islands are also less geographically diverse so there are fewer niches to promote speciation. And finally, smaller islands support smaller populations, so the probability of extinction is higher.
As islands get larger, the number of species accelerates, although the effect of island area on species numbers is not a direct correlation. Conservation preserves can be seen as “islands” of habitat within “an ocean” of non-habitat. For a species to persist in a preserve, the preserve must be large enough. The critical size depends, in part, on the home range that is characteristic of the species. A preserve for wolves, which range hundreds of kilometers, must be much larger than a preserve for butterflies, which might range within ten kilometers during its lifetime. But larger preserves have more core area of optimal habitat for individual species, they have more niches to support more species, and they attract more species because they can be found and reached more easily.
Preserves perform better when there are buffer zones around them of suboptimal habitat. The buffer allows organisms to exit the boundaries of the preserve without immediate negative consequences from predation or lack of resources. One large preserve is better than the same area of several smaller preserves because there is more core habitat unaffected by edges. For this same reason, preserves in the shape of a square or circle will be better than a preserve with many thin “arms.” If preserves must be smaller, then providing wildlife corridors between them so that individuals and their genes can move between the preserves, for example along rivers and streams, will make the smaller preserves behave more like a large one. All of these factors are taken into consideration when planning the nature of a preserve before the land is set aside.
In addition to the physical, biological, and ecological specifications of a preserve, there are a variety of policy, legislative, and enforcement specifications related to uses of the preserve for functions other than protection of species. These can include anything from timber extraction, mineral extraction, regulated hunting, human habitation, and nondestructive human recreation. Many of these policy decisions are made based on political pressures rather than conservation considerations. In some cases, wildlife protection policies have been so strict that subsistence-living indigenous populations have been forced from ancestral lands that fell within a preserve. In other cases, even if a preserve is designed to protect wildlife, if the protections are not or cannot be enforced, the preserve status will have little meaning in the face of illegal poaching and timber extraction. This is a widespread problem with preserves in areas of the tropics.
Limitations on Preserves
Some of the limitations on preserves as conservation tools are evident from the discussion of preserve design. Political and economic pressures typically make preserves smaller, never larger, so setting aside areas that are large enough is difficult. If the area set aside is sufficiently large, there may not be sufficient area to create a buffer around the preserve. In this case, an area on the outer edges of the preserve inevitably becomes a riskier suboptimal habitat for the species in the preserve. Enforcement of protections is also a significant issue in countries without the resources or political will to prevent poaching and illegal resource extraction.
Climate change will create inevitable problems with the location of preserves. The species within them will migrate to higher latitudes as the habitat of the preserve becomes less favorable. Scientists are planning for the effects of global warming on future preserves and striving to predict the need for new preserves to accommodate anticipated changes to habitats; however, the end effectiveness is tenuous since these efforts are prediction based.
Finally, an argument can be made that conservation preserves reinforce the cultural perception that humans are separate from nature, can exist outside of it, and can only operate in ways that do damage to biodiversity. Creating preserves reduces the pressure on human activities outside the preserves to be sustainable and non-damaging to biodiversity. Ultimately, the political, economic, and human demographic pressures will degrade and reduce the size of conservation preserves if the activities outside them are not altered to be less damaging to biodiversity.
Habitat Restoration
Habitat restoration holds considerable promise as a mechanism for restoring and maintaining biodiversity. Of course once a species has become extinct, its restoration is impossible. However, restoration can improve the biodiversity of degraded ecosystems. Reintroducing wolves, a top predator, to Yellowstone National Park in 1995 led to dramatic changes in the ecosystem that increased biodiversity. The wolves (Figure 17) function to suppress elk and coyote populations and provide more abundant resources to the guild of carrion eaters. Reducing elk populations has allowed revegetation of riparian areas, which has increased the diversity of species in that habitat. Decreasing the coyote population has increased the populations of species that were previously suppressed by this predator. The number of species of carrion eaters has increased because of the predatory activities of the wolves. In this habitat, the wolf is a keystone species, meaning a species that is instrumental in maintaining diversity in an ecosystem. Removing a keystone species from an ecological community may cause a collapse in diversity. The results from the Yellowstone experiment suggest that restoring a keystone species can have the effect of restoring biodiversity in the community. Ecologists have argued for the identification of keystone species where possible and for focusing protection efforts on those species; likewise, it also makes sense to attempt to return them to their ecosystem if they have been removed.

Figure 17. (a) The Gibbon wolf pack in Yellowstone National Park, March 1, 2007, represents a keystone species. The reintroduction of wolves into Yellowstone National Park in 1995 led to a change in the grazing behavior of (b) elk. To avoid predation, the elk no longer grazed exposed stream and riverbeds, such as (c) the Lamar Riverbed in Yellowstone. This allowed willow and cottonwood seedlings to grow. The seedlings decreased erosion and provided shading to the creek, which improved fish habitat. A new colony of (d) beaver may also have benefited from the habitat change. (credit a: modification of work by Doug Smith, NPS; credit c: modification of work by Jim Peaco, NPS; credit d: modification of work by “Shiny Things”/Flickr.
Other large-scale restoration experiments underway involve dam removal. In the United States, since the mid-1980s, many aging dams are being considered for removal rather than replacement because of shifting beliefs about the ecological value of free-flowing rivers and because many dams no longer provide the benefit and functions that they did when they were first built. The measured benefits of dam removal include restoration of naturally fluctuating water levels (the purpose of dams is frequently to reduce variation in river flows), which leads to increased fish diversity and improved water quality. In the Pacific Northwest, dam removal projects are expected to increase populations of salmon, which is considered a keystone species because it transports key nutrients to inland ecosystems during its annual spawning migrations. In other regions such as the Atlantic coast, dam removal has allowed the return of spawning anadromous fish species (species that are born in fresh water, live most of their lives in salt water, and return to fresh water to spawn). Some of the largest dam removal projects have yet to occur or have happened too recently for the consequences to be measured. The large-scale ecological experiments that these removal projects constitute will provide valuable data for other dam projects slated either for removal or construction.
The Role of Captive Breeding
Zoos have sought to play a role in conservation efforts both through captive breeding programs and education. The transformation of the missions of zoos from collection and exhibition facilities to organizations that are dedicated to conservation is ongoing. In general, it has been recognized that, except in some specific targeted cases, captive breeding programs for endangered species are inefficient and often prone to failure when the species are reintroduced to the wild. Zoo facilities are far too limited to contemplate captive breeding programs for the numbers of species that are now at risk. Education is another potential positive impact of zoos on conservation efforts, particularly given the global trend to urbanization and the consequent reduction in contacts between people and wildlife. A number of studies have been performed to look at the effectiveness of zoos on people’s attitudes and actions regarding conservation; at present, the results tend to be mixed.
In Summary: Conservation Biology and Biodiversity
Biodiversity exists at multiple levels of organization and is measured in different ways depending on the goals of those taking the measurements. These measurements include numbers of species, genetic diversity, chemical diversity, and ecosystem diversity. The number of described species is estimated to be 1.5 million with about 17,000 new species being described each year. Estimates for the total number of species on Earth vary but are on the order of 10 million. Biodiversity is negatively correlated with latitude for most taxa, meaning that biodiversity is higher in the tropics. The mechanism for this pattern is not known with certainty, but several plausible hypotheses have been advanced.
Five mass extinctions with losses of more than 50 percent of extant species are observable in the fossil record. Biodiversity recovery times after mass extinctions vary, but have been up to 30 million years. Recent extinctions are recorded in written history and are the basis for one method of estimating contemporary extinction rates. The other method uses measures of habitat loss and species-area relationships. Estimates of contemporary extinction rates vary, but some rates are as high as 500 times the background rate, as determined from the fossil record, and are predicted to rise.
Humans use many compounds that were first discovered or derived from living organisms as medicines: secondary plant compounds, animal toxins, and antibiotics produced by bacteria and fungi. More medicines are expected to be discovered in nature. Loss of biodiversity will impact the number of pharmaceuticals available to humans.
Crop diversity is a requirement for food security, and it is being lost. The loss of wild relatives to crops also threatens breeders’ abilities to create new varieties. Ecosystems provide ecosystem services that support human agriculture: pollination, nutrient cycling, pest control, and soil development and maintenance. Loss of biodiversity threatens these ecosystem services and risks making food production more expensive or impossible. Wild food sources are mainly aquatic, but few are being managed for sustainability. Fisheries’ ability to provide protein to human populations is threatened when extinction occurs.
Biodiversity may provide important psychological benefits to humans. Additionally, there are moral arguments for the maintenance of biodiversity.
The core threats to biodiversity are human population growth and unsustainable resource use. To date, the most significant causes of extinctions are habitat loss, introduction of exotic species, and overharvesting. Climate change is predicted to be a significant cause of extinctions in the coming century. Habitat loss occurs through deforestation, damming of rivers, and other activities. Overharvesting is a threat particularly to aquatic species, while the taking of bush meat in the humid tropics threatens many species in Asia, Africa, and the Americas. Exotic species have been the cause of a number of extinctions and are especially damaging to islands and lakes. Exotic species’ introductions are increasing because of the increased mobility of human populations and growing global trade and transportation. Climate change is forcing range changes that may lead to extinction. It is also affecting adaptations to the timing of resource availability that negatively affects species in seasonal environments. The impacts of climate change are greatest in the arctic. Global warming will also raise sea levels, eliminating some islands and reducing the area of all others.
New technological methods such as DNA barcoding and information processing and accessibility are facilitating the cataloging of the planet’s biodiversity. There is also a legislative framework for biodiversity protection. International treaties such as CITES regulate the transportation of endangered species across international borders. Legislation within individual countries protecting species and agreements on global warming have had limited success; there is at present no international agreement on targets for greenhouse gas emissions. In the United States, the Endangered Species Act protects listed species but is hampered by procedural difficulties and a focus on individual species. The Migratory Bird Act is an agreement between Canada and the United States to protect migratory birds. The non-profit sector is also very active in conservation efforts in a variety of ways.
Conservation preserves are a major tool in biodiversity protection. Presently, 11percent of Earth’s land surface is protected in some way. The science of island biogeography has informed the optimal design of preserves; however, preserves have limitations imposed by political and economic forces. In addition, climate change will limit the effectiveness of preserves in the future. A downside of preserves is that they may lessen the pressure on human societies to function more sustainably outside the preserves.
Habitat restoration has the potential to restore ecosystems to previous biodiversity levels before species become extinct. Examples of restoration include reintroduction of keystone species and removal of dams on rivers. Zoos have attempted to take a more active role in conservation and can have a limited role in captive breeding programs. Zoos also may have a useful role in education.
Check Your Understanding
Answer the question(s) below to see how well you understand the topics covered in the previous section. This short quiz does not count toward your grade in the class, and you can retake it an unlimited number of times.
Use this quiz to check your understanding and decide whether to (1) study the previous section further or (2) move on to the next section.
Candela Citations
- Intoduction to Conservation Biology and Biodiversity. Authored by: Shelli Carter and Lumen Learning. Provided by: Lumen Learning. License: CC BY: Attribution
- Biology. Provided by: OpenStax CNX. Located at: http://cnx.org/contents/185cbf87-c72e-48f5-b51e-f14f21b5eabd@10.8. License: CC BY: Attribution. License Terms: Download for free at http://cnx.org/contents/185cbf87-c72e-48f5-b51e-f14f21b5eabd@10.8
- Modification of Pundamilia (Haplochromis) nyererei male. Authored by: Kevin Bauman. Located at: https://commons.wikimedia.org/wiki/File:Pundamilia_(Haplochromis)_nyererei_male.jpg. License: CC BY: Attribution
- Haplochromis vonlinnei. Authored by: M.J.P. van Oijen & M.P. de Zeeuw. Located at: https://en.wikipedia.org/wiki/File:Haplochromis_vonlinnei01.jpg. License: CC BY: Attribution
- Conservation and Restoration Ecology. Authored by: CrashCourse. Located at: https://youtu.be/Kaeyr5-O2eU. Project: Crash Course Ecology. License: All Rights Reserved. License Terms: Standard YouTube License
- Mora Camilo et al., “How Many Species Are There on Earth and in the Ocean?” PLoS Biology (2011), doi:10.1371/journal.pbio.1001127. ↵
- Arthur D. Chapman, Numbers of Living Species in Australia and the World, 2nd ed. (Canberra, AU: Australian Biological Resources Study, 2009). http://www.environment.gov.au/biodiversity/abrs/publications/other/species-numbers/2009/pubs/nlsaw-2nd-complete.pdf. ↵
- Brian Groombridge and Martin D. Jenkins. World Atlas of Biodiversity: Earth’s Living Resources in the 21st Century. Berkeley: University of California Press, 2002. ↵
- International Institute for Species Exploration (IISE), 2011 State of Observed Species (SOS). Tempe, AZ: IISE, 2011. Accessed May, 20, 2012. http://species.asu.edu/SOS. ↵
- Robert H. MacArthur and Edward O. Wilson, E. O., The Theory of Island Biogeography (Princeton, N.J.: Princeton University Press, 1967). ↵