Learning Objectives
- Under appropriate conditions, conduct a hypothesis test about a population mean. State a conclusion in context.
More on Checking Conditions for a T-Test
In practice, you will often see the use of a t-test with small samples. Technically, we can use the t-test with small samples only if we know the variable has a normal distribution in the population. But this is hard to verify. In addition, no variable has a perfect normal distribution. So what does the requirement that the “variable be normally distributed in the population” really mean?
We call a confidence interval or a hypothesis test robust if the confidence level or P-value does not change very much when the conditions for use of the procedure are not met.
T-procedures are robust when the variable is not normally distributed in the population, as long as the distribution is not heavily skewed. But how can we determine if the distribution of the variable in the population is heavily skewed? In this introductory course, we examine the distribution of the variable in the sample and make an educated guess about what is going on in the population.
Now we investigate this question: Can we tell from a sample whether the variable is normally distributed in the population?
Example
Variable Skewed in the Population
Let’s start with a skewed distribution in the population. Can we tell that this distribution is not normal by looking at random samples?
The following figure shows the monthly payment on first home mortgages for 5,000 people, as reported in the 2000 U.S. Census. Think of this as data from the population of a small town. From this population, we randomly selected 20 people. We did this three times. Notice that for each random sample, the shape of the distribution of the monthly payments in the sample is skewed to the right, just like the distribution in the population. In 2 of the 3 samples, we also see outliers, just as we see in the population. So by looking at the sample, we can get a pretty good sense that the variable is not normally distributed in the population.
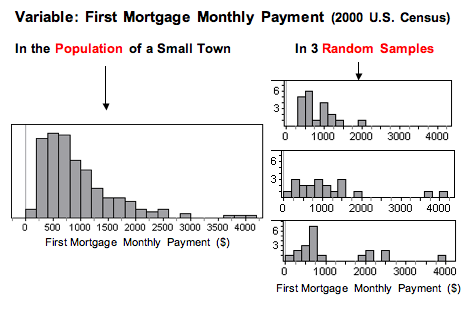
In this example, the sample size is less than 30. We can use the t-test only if the variable is normally distributed in the population. The shape of the distribution in any one of these samples suggests that the variable has a skewed distribution in the population, so we would not conduct a t-test with any of these samples.
Example
Variable Normal in the Population
Now we look at a variable that has an approximately normal distribution in the population. Can we tell that this distribution is approximately normal by looking at random samples?
The following graphs show the heights (in centimeters) of 5,000 women. Think of this as data from the population of a small town. From this population, we randomly selected 20 women. We did this three times. Notice that for each random sample, the shape of the distribution of the heights in the sample is not skewed, and there are no outliers. By looking at the sample, we can get a pretty good sense that the variable is not skewed in the population, which suggests that the variable may be somewhat normally distributed in the population.
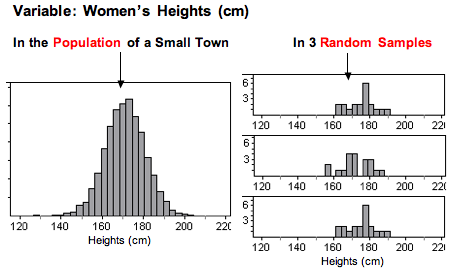
In this example, the sample size is less than 30. We can only use the t-test if the variable is normally distributed in the population. The shape of the distribution in any one of these samples indicates that the variable does not have a skewed distribution in the population, suggesting that the distribution in the population is somewhat normal. Since the t-procedures are robust, we would conduct a t-test with any of these samples.
What’s the Main Point?
We previously stated the conditions for use of the t-procedures as follows:
(1) If the variable is normally distributed in the population, you can always use the t-procedures.
(2) If the variable is not normally distributed in the population (or you can’t determine this factor), the sample size must be greater than 30 for safe use of the t-procedures.
We are now loosening these conditions somewhat because the t-procedures are robust.
(3) If the sample is small (n ≤ 30), plot the data. If the distribution in the sample is not heavily skewed and does not have outliers, then we assume the variable is somewhat normally distributed in the population, so we use t-procedures.
Comment
If we use a t-procedure for a small sample (n ≤ 30), it is good practice to include a disclaimer with the conclusion. We might say something like, “On the basis of the sample, we are assuming that the variable is distributed without strong skew or extreme outliers in the population. The conclusion from this test is valid only if this assumption is true.”
Learn By Doing
Each histogram in the following questions represents a random sample. We do not know if the variable has a normal distribution in the population, but we want to run a t-test to test a claim about the population mean. For each histogram, choose the option that best describes how to proceed with the hypothesis test.
Comment
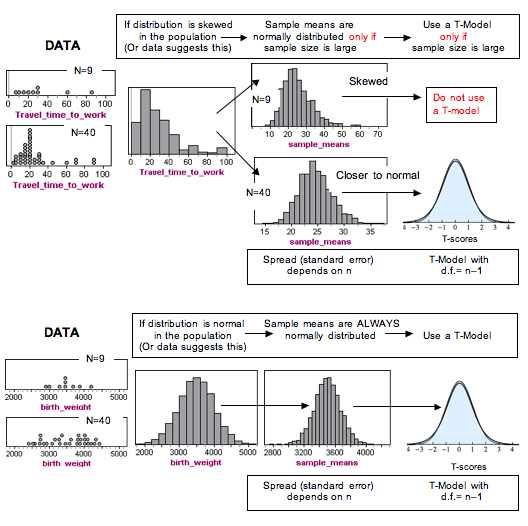
Recall that the sample mean and standard deviation are not resistant to outliers. An outlier in the data can make the mean and standard deviation poor measures of center and spread. So why can we use data from large samples even if the data has an outlier? Well, if the sample is large enough, the distribution of sample means will still be approximately normal. And the t-model will be a good fit when we estimate the standard error of the sample means using the sample standard deviation. This is the important point. The P-value and confidence level come from a model of the sampling distribution, not from a model of the population’s distribution.
Summary in a Diagram
Candela Citations
- Concepts in Statistics. Provided by: Open Learning Initiative. Located at: http://oli.cmu.edu. License: CC BY: Attribution