Learning Objectives
- Draw and label a potential energy diagram for a two-step reaction.
- Describe the use of a potential energy diagram for identifying the rate-limiting step in a multi-step reaction.
Roller coasters-fun or frightful?

Roller Coaster. From Greg Bulla (Wikipedia: Gb1).
For many people, a roller coaster is the epitome of excitement, while for others it is a torture device to be avoided at all costs (and some folks are in-between). For a roller coaster, the rate-limiting step is the climb up to the top at the beginning of the ride, where the cars are hauled slowly to the peak of the ride. This peak must be the highest because the potential energy at this point must be enough to cause the roller coaster to move through the smaller peaks without stopping.
Potential Energy Diagrams
The potential energy diagram can illustrate the mechanism for a reaction by showing each elementary step of the reaction with distinct activation energy (see Figure below ).
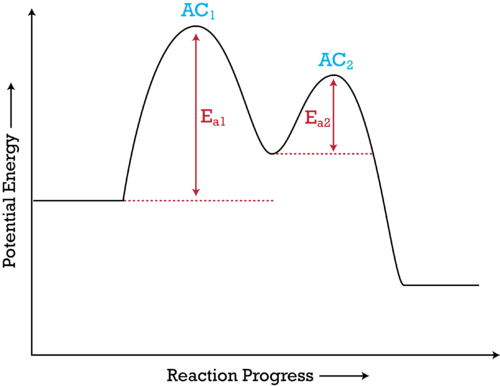
Figure 1. The potential energy diagram shows an activation energy peak for each of the elementary steps of the reaction. The valley between represents the intermediate for the reaction. From the CK-12 Foundation – Christopher Auyeung.
The reaction whose potential energy diagram is shown in the figure is a two-step reaction. The activation energy for each step is labeled Ea1 and Ea2. Each elementary step has its own activated complex, labeled AC1 and AC2. Note that the overall enthalpy change of the reaction [latex]\left(\Delta{H}\right)[/latex] is unaffected by the individual steps, since it depends only on the initial and final states.
In this example, the rate-limiting step in the reaction is the first step, leading to the formation of the activated complex AC1. The activation energy is higher for this step than for step two, which has a considerably lower activation energy. If the rate-limiting step were the second step, the peak labeled AC2 would be higher than the peak for AC1 and Ea2 would be greater than Ea1 . The same approach can be taken for a potential energy diagram with more than two peaks.
Summary
- A potential energy diagram for a two-step reaction is shown and labeled.
Review
- What does a potential energy diagram tell us?
- In the diagram above, which step has the highest activation energy?
- If a catalyst lowered the step one activation energy to a value lower than the step two activation energy, which step would be rate-limiting?
Candela Citations
- Chemistry Concepts Intermediate. Authored by: Calbreath, Baxter, et al.. Provided by: CK12.org. Located at: http://www.ck12.org/book/CK-12-Chemistry-Concepts-Intermediate/. License: CC BY-NC: Attribution-NonCommercial