Learning Outcomes
- Define a polynomial function
- Identify the end behavior of the graph of a polynomial function based on the degree of the function and the sign of the leading coefficient
- Define zeros of a function
- Explain the relationship between zeros and [latex]x[/latex]-intercepts on the graph of the function
- Explain the relationship between the degree of a polynomial function and the number of turning points on its graph
Polynomial Functions
A polynomial function is any function that is a term or a sum (or difference) of terms in which each term is a real number, a variable, or the product of a real number and variable with whole number exponents. In other words, a polynomial function consists of a polynomial.
In this chapter, we will focus on one-variable polynomial functions, like [latex]f(x)=-2x+4[/latex], [latex]g(x)=2x^2-2x+4[/latex], or [latex]h(x)=x^5+2x^3-12x+3[/latex]. Notice that these polynomial functions are written in descending order from the highest exponent to the lowest.
polynomial functions in one variable
A one-variable polynomial function has the form:
[latex]f\left(x\right)={a}_{n}{x}^{n}+{a}_{n - 1}{x}^{n - 1}+…+{a}_{1}x+{a}_{0}[/latex]
where [latex]a_0, a_1,..., a_n[/latex] are real numbers, and [latex]n[/latex] is a positive integer.
Identifying the Shape of the Graph of a Polynomial Function
Knowing the degree of a polynomial function is useful in helping us predict what its graph will look like. The leading term has the highest exponent on the variable, meaning that the leading term will grow significantly faster than the other terms in the function as [latex]x[/latex] gets very large or very small. So, the behavior of the leading term will dominate the graph.
As an example, we compare the outputs of a degree [latex]2[/latex] polynomial and a degree [latex]5[/latex] polynomial in table 1.
| [latex]x[/latex] | [latex]f(x)=2x^2-2x+4[/latex] | [latex]g(x)=x^5+2x^3-12x+3[/latex] |
|---|---|---|
| [latex]1[/latex] | [latex]4[/latex] | [latex]8[/latex] |
| [latex]10[/latex] | [latex]184[/latex] | [latex]98,117[/latex] |
| [latex]100[/latex] | [latex]19,804[/latex] | [latex]9,998,001,197[/latex] |
| [latex]1000[/latex] | [latex]1,998,004[/latex] | [latex]9,999,980,000,000,000[/latex] |
| Table 1. Comparative growth of polynomial functions. | ||
As the inputs for both functions get larger, the degree [latex]5[/latex] polynomial outputs get much larger than the degree [latex]2[/latex] polynomial outputs. This is why we use the leading term to get a rough idea of the behavior of the graphs of polynomial functions as the independent variable gets very large or very small. This is referred to as the end behavior of the graph.
Let’s take a look at the graphs of some polynomial functions and determine any patterns that exist in their graphs.
|
Odd degree
|
Even degree
|
|---|---|
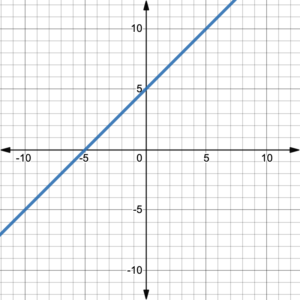
Figure 1. Degree 1 polynomial function. |
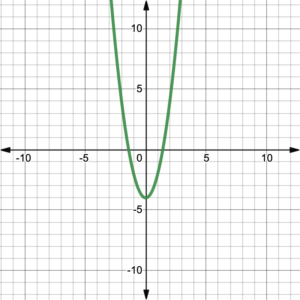
Figure 2. Degree 2 polynomial function. |
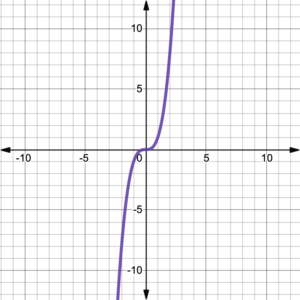
Figure 3. Degree 3 polynomial function. |
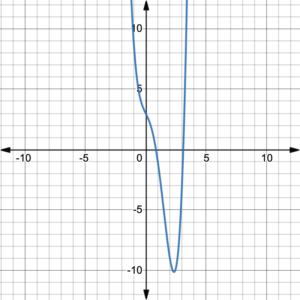
Figure 4. Degree 4 polynomial function. |
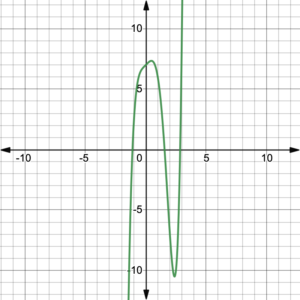
Figure 5. Degree 5 polynomial function. |
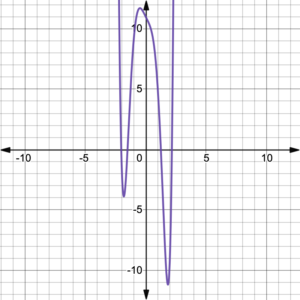
Figure 6. Degree 6 polynomial function |
All of the graphs in figures 1 – 6, represent polynomial functions with positive leading coefficients. Notice that figures 1, 3, and 5 show graphs of functions with odd degrees, while figures 2, 4, and 6 show graphs of functions with even degrees. All of the odd degree polynomial functions have graphs that come from the bottom left and end up at the top right. Think John Travolta in Saturday Night Fever–Right arm up, left arm down! On the other hand, all of the even degree polynomial functions have graphs that start at the top left and end up at the top right. Think football touchdown!
If we look at graphs of the parent functions [latex]f(x)=x^n[/latex], we will notice some major similarities.
Odd Degree Polynomials
Figure 7 shows the graphs of [latex]f\left(x\right)={x}^{1},\;f\left(x\right)={x}^{3},\;f\left(x\right)={x}^{5}[/latex], and [latex]f(x)=x^{51}[/latex], which all have odd degrees. When [latex]n=1[/latex] we have the linear function [latex]f(x)=x[/latex] whose graph is a line. The graphs when [latex]n=3, 5, ...[/latex] all have similar end behavior that is right-up and left-down. This is because the value of the function goes to positive infinity as the value of [latex]x[/latex] goes to positive infinity and the value of the function goes to negative infinity as the value of [latex]x[/latex] goes to negative infinity.
Notice that as the power increases, the graphs flatten somewhat near the origin ([latex]-1
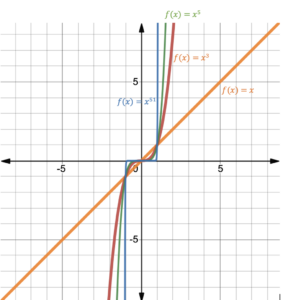
Figure 7. Odd degree polynomial functions
Even Degree Polynomials
Figure 8 shows the graphs of [latex]f\left(x\right)={x}^{2},\;f\left(x\right)={x}^{4},\;f\left(x\right)={x}^{6}[/latex], and [latex]f(x)=x^{50}[/latex], which all have even degrees. These graphs have similar end behavior that is right-up and left-up. This is because the value of the function goes to positive infinity as the value of [latex]x[/latex] goes to either positive or negative infinity (e.g., a number to an even power, no matter the number is positive or negative, is always positive).
Notice that as the power increases, the graphs flatten somewhat near the origin (between [latex]-1
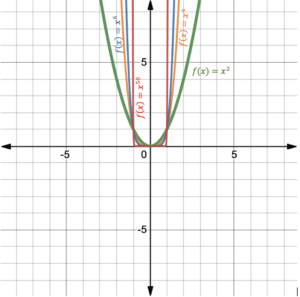
Figure 8. Graph of even degree polynomial functions
Example 1
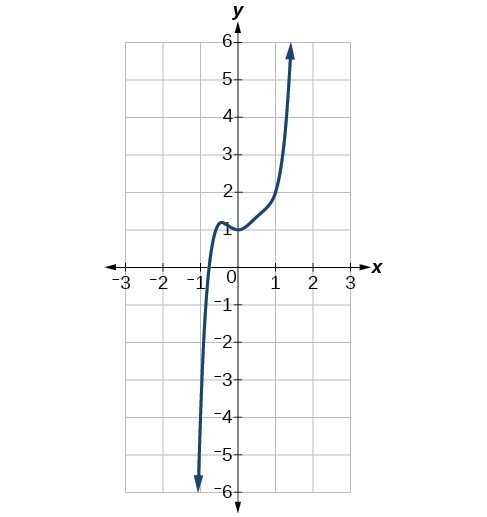
Identify whether each graph represents a polynomial function that has a degree that is even or odd.
a)

b)
Solution
a) Both arms of this polynomial point upward, therefore the degree must be even. If we apply negative inputs to an even degree polynomial, you will get positive outputs back.
b) As the inputs of this polynomial become more negative the outputs also become negative. The only way this is possible is with an odd degree polynomial. Therefore, this polynomial must have an odd degree.
Try It 1
Identify whether each graph represents a polynomial function that has a degree that is even or odd.
|
Up on both sides
|
Up on right, down on left
|
|---|---|

Graph 1 |

Graph 2 |
The Sign of the Leading Term
We saw in previous chapters that reflecting a function across the [latex]x[/latex]-axis results in changing the sign of all the [latex]y[/latex]-values on the graph to their opposites. If the parent function [latex]f(x)=x^n[/latex] is reflected across the [latex]x[/latex]-axis, the function [latex]f(x)=-x^n[/latex] represents the new function. The reflected function now has a negative leading coefficient.
Consider the two functions [latex]f(x)=x^2[/latex] and [latex]f(x)=x^3[/latex], one even and one odd. If we change the sign of the leading term, the functions become [latex]f(x)=-x^2[/latex] and [latex]f(x)=-x^3[/latex]. Now let’s look at the graphs:
|
Negative leading coefficient
|
Negative leading coefficient
|
|---|---|
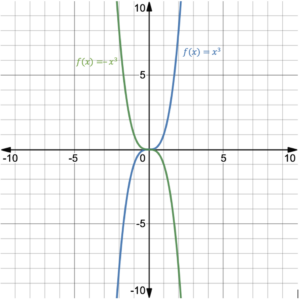
FIgure 9. [latex]f(x)=x^3[/latex] and [latex]f(x)=-x^3[/latex] |
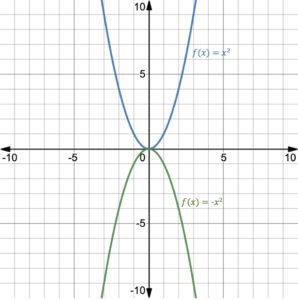
Figure 10. [latex]f(x)=x^2[/latex] and [latex]f(x)-x^2[/latex] |
Figures 9 and 10 show that a negative leading term changes the end behavior of the graphs, equivalent to reflection across the [latex]x[/latex]-axis.
example 2
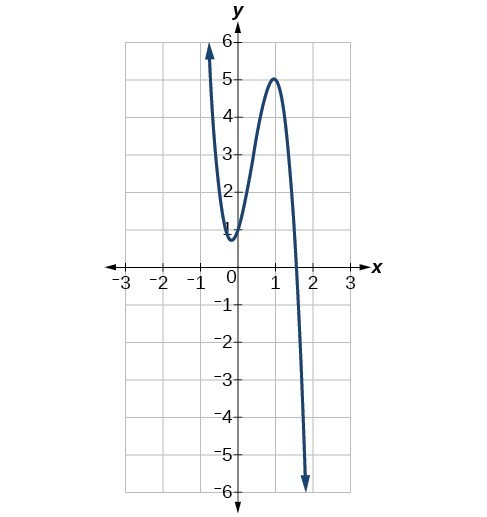
Identify whether the leading term is positive or negative and whether the degree is even or odd for the following graphs of polynomial functions.
|
Right side down, left side down
|
Right side down, left side up |
|---|---|

Graph 1. |
Graph 2. |
Solution
Graph 1: Both arms of the graph are heading in the same direction, so the degree of the function is even. SInce the arms are both pointing downwards, the leading coefficient is negative.
Graph 2: The arms of the graph are going in opposite directions, so the degree of the function is odd. Since the graph is moving from top left to bottom right, the leading coefficient is negative.
Try It 2
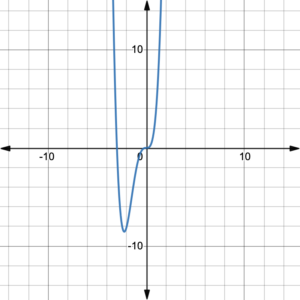
Identify whether the leading coefficient is positive or negative and whether the degree is even or odd for the following graphs of polynomial functions.
|
Graph 1
|
Graph 2
|
Graph 3
|
|---|---|---|
 |
 |
 |
Zeros
A zero of a function [latex]f(x)[/latex] is any value of the independent variable [latex]x[/latex] that causes the function value to equal zero. i.e., [latex]f(x) = 0[/latex]. On the coordinate plane, zeros are the intersection points between the graph of a function [latex]y=f(x)[/latex] and the [latex]x[/latex]-axis. In other words, they are the [latex]x[/latex]-intercepts. Since [latex]f(x) = 0[/latex], each intersection point has a [latex]y[/latex]-coordinate of 0.
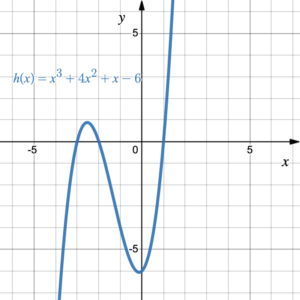
Figure 11. Graph of [latex]h(x)=x^3+4x^2+x-6[/latex]
Figure 11 shows the graph of [latex]h(x)=x^3+4x^2+x-6[/latex]. The graph of the function has [latex]x[/latex]-intercepts at the points (–3, 0), (–2, 0), and (1, 0). Therefore, the zeros of the function are [latex]x = –3, –2[/latex] and [latex]1[/latex].
Notice that when we identify an [latex]x[/latex]-intercept we write it as a point: e.g., (–2, 0). However, when we identify a zero, we write is as a solution of the equation [latex]f(x)=0[/latex]: e.g., [latex]x=–2[/latex].
Example 3
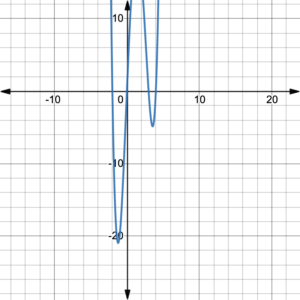
Use the graph of the polynomial function of degree 6 to identify the zeros of the function.

Solution
The [latex]x[/latex]-intercepts are (–3, 0), (–1, 0), and (4, 0). Therefore, the zeros are [latex]x=[/latex] –3, –1, and 4.
Try It 3
Use the graph of the polynomial function of degree 6 to identify the zeros of the function.
The Number of Turning Points
When the [latex]y[/latex]-values of a graph increase as [latex]x[/latex] increases, we say the graph is increasing over the given [latex]x[/latex]-values. Likewise, when the [latex]y[/latex]-values of a graph decrease as [latex]x[/latex] increases, we say the graph is decreasing over the given [latex]x[/latex]-values. The point where a graph changes from increasing to decreasing or vice versa is called a turning point. This is illustrated in figure 12 where the graph of the function has 3 turning points.
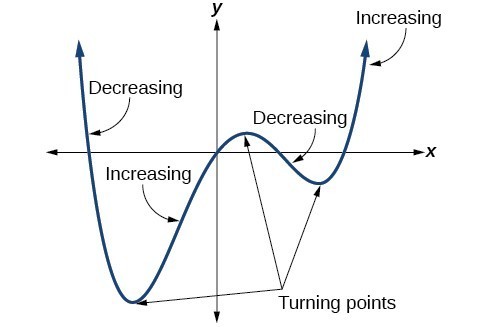
Figure 12. A function with turning points
The number of turning points the graph of a polynomial function has is dependent upon the degree of the polynomial.
Number of turning points
A polynomial function [latex]f(x)[/latex] of degree [latex]n[/latex], has at most [latex]n-1[/latex] turning points.
This does not mean that, for example the polynomial function [latex]f(x)=x^8[/latex] has 7 turning points. Rather, the function has at most 7 turning points. In reality, the graph of the function [latex]f(x)=x^8[/latex] has only one turning point (figure 13).
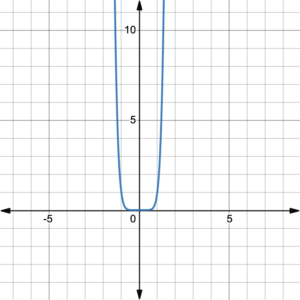
Figure 13. Graph of [latex]f(x)=x^8[/latex]
Example 4
- Determine the maximum number of turning points of the graph of the function [latex]f\left(x\right)=x^{5}-3x^{4}+x^{3}+2x^{2}+4[/latex].
- Use Desmos to graph the function.
- Show the intervals of [latex]x[/latex] on the graph when the function is increasing and when it is decreasing.
- How many turning points are on the graph?
Solution
1.[latex]f\left(x\right)=x^{5}-3x^{4}+x^{3}+2x^{2}+4[/latex] has degree 5, so the graph has at most 4 turning points.
| How many turning points? | Increasing or decreasing? |
|---|---|
2.  |
3.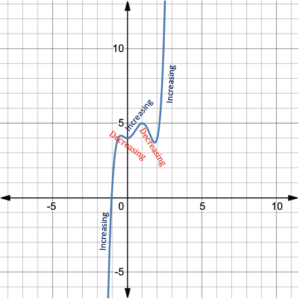 |
4. There are 4 turning points.
Try It 4
The graph shows the function [latex]f\left(x\right)=x^{4}+2x^{3}+4[/latex].
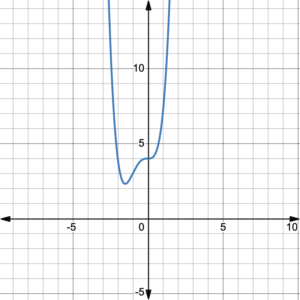
- What is the maximum number of turning points of the graph of [latex]f\left(x\right)=x^{4}+2x^{3}+4[/latex]?
- Show the intervals of [latex]x[/latex] on the graph when the function is increasing and when it is decreasing.
- How many turning points are on the graph?
Notice in the last Try It, there is a flat area on the graph at [latex]x=0[/latex]. At this point, the graph is neither increasing nor decreasing. It goes from increasing to taking a breath to increasing again. The same thing can happen when the graph is decreasing then stalls for a moment then decreases again. Such a point is called a point of inflection.
Candela Citations
- 3.1.2: Polynomial Functions and Their Graphs. Authored by: Leo Chang and Hazel McKenna. Provided by: Utah Valley University. License: CC BY: Attribution
- Revision and Adaptation. Authored by: Hazel McKenna. Provided by: Utah Valley University. License: CC BY: Attribution
- All graphs created using Desmos graphing calculator. Authored by: Hazel McKenna. Provided by: Utah Valley University. Located at: http://Desmos.com. License: CC BY: Attribution
- College Algebra. Authored by: Abramson, Jay, et al.. Provided by: OpenStax. Located at: http://cnx.org/contents/fd53eae1-fa23-47c7-bb1b-972349835c3c@5.175. License: CC BY: Attribution. License Terms: Download for free at: http://cnx.org/contents/fd53eae1-fa23-47c7-bb1b-972349835c3c@5.175

