Learning Outcomes
- Graph the quadratic function [latex]f(x)=x^2[/latex]
- Identify the vertex, line of symmetry, [latex]x[/latex]-intercept(s), [latex]y[/latex]-intercept, and vertex of a parabola
- Determine if a parabola has a minimum or maximum and find that value
- Identify the symmetric point given a point on the parabola and the line of symmetry
- Find the [latex]x[/latex]-coordinate of the vertex using two symmetric points
- Identify the domain and range of a quadratic function
Graphing a Quadratic Function
One way to graph a function is to make a table of values and transfer the resulting coordinate pairs onto the coordinate plane. Then we can connect the plotted points to sketch the graph of the function.
The function [latex]f(x)=x^2[/latex] is a polynomial function of degree 2. Such polynomial functions are also called quadratic functions. To graph the quadratic function [latex]f(x)=x^2[/latex], we can generate the table of values in table 1. We can choose any [latex]x[/latex]-values we want, but it is best to cover both positive and negative values of [latex]x[/latex] so that the graph may be comprehensive rather than only showing part of the graph.
| [latex]x[/latex] | [latex]f(x)=x^2[/latex] |
|---|---|
| -3 | 9 |
| -2 | 4 |
| -1 | 1 |
| 0 | 0 |
| 1 | 1 |
| 2 | 4 |
| 3 | 9 |
| Table 1. Table of values for [latex]f(x)=x^2[/latex] | |
Now, we take each [latex](x, f(x))[/latex] pair on the table as a coordinate pair [latex](x, y)[/latex] and plot them on the coordinate plane. We cannot connect these points using straight lines because the function is not linear (i.e., the exponent of the independent variable [latex]x[/latex] is not 1). That is, the slopes between any two points are not a constant. For example, we use a curve instead of a straight line to connect the two points (1,1) and (2,4) because you can find another point (1.5, 2.25) on the graph between the two points, and the slope between point (1,1) and (1.5, 2.25) is 2.5 but the slope between (1.5, 2.25) and (2, 4) is 3.5. Therefore, we cannot connect the two points (1,1) and (2,4) with a straight line because the slopes between the two points are different (i.e., [latex]2.5 \neq 3.5[/latex]). Since it is a polynomial, we will use a curve to connect these points on the coordinate plane (figure 1). The shape of this curve is called a parabola.

Figure 1. The graph of the function [latex]f(x)=x^2[/latex].
The function [latex]f(x)=x^2[/latex] is the parent function of all quadratic functions, which can be written in the form [latex]f(x)=ax^2+bx+c[/latex], where [latex]a, b, c[/latex] are real numbers with [latex]a\ne0[/latex]. The parabola will open upwards if [latex]a>0[/latex] and will open downwards if [latex]a<0[/latex] (figure 2).

Figure 2. Parabola opens up when [latex]a>0[/latex] and down when [latex]a<0[/latex] on graph of [latex]f(x)=ax^2+bx+c[/latex]
Features of the Graph of a Quadratic Function
One important feature of the graph of a quadratic function (a parabola) is that it has a turning point, called the vertex. If the parabola opens up, the vertex represents the lowest point on the graph, or the minimum value of the quadratic function. If the parabola opens down, the vertex represents the highest point on the graph, or the maximum value. In either case, the vertex is a turning point on the graph. The graph is also symmetric about a vertical line that passes through the vertex, called the line (or axis) of symmetry (figure 3).
Figure 3. The vertex is always on the axis of symmetry.
The intersection points between the graph and the [latex]x[/latex]-axis are the [latex]x[/latex]-intercepts. There can be 0, 1, or 2 [latex]x[/latex]-intercepts, depending where the graph lies on the coordinate plane. The intersection point between the graph and the [latex]y[/latex]-axis is the [latex]y[/latex]-intercept (figure 4).
| No x-intercepts |
One x-intercept
|
Two x-intercepts
|
|---|---|---|

Parabola opening up with a minimum function value and no [latex]x[/latex]-intercepts. |

Parabola opening up with a minimum function value and one [latex]x[/latex]-intercepts. |

Parabola opening down with a maximum function value and two [latex]x[/latex]-intercepts |
|
Figure 4. Parabolas with 0, 1, and 2 [latex]x[/latex]-intercepts
|
||
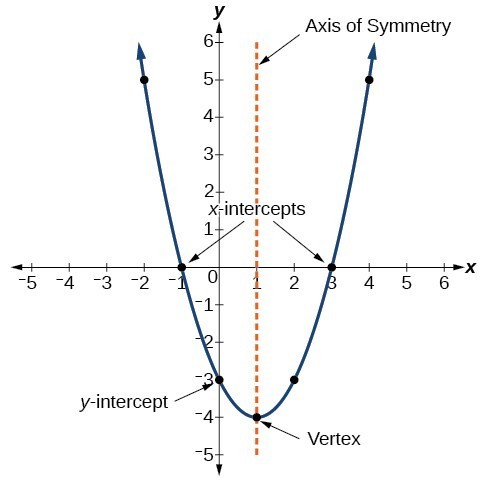
The parabola in figure 5 has [latex]x[/latex]-intercepts of (–1, 0) and (3, 0). The [latex]y[/latex]-intercept is (0, –3) and the vertex is (1, –4). The equation for the line of symmetry is [latex]x=1[/latex] because it is a vertical line that passes through the vertex (1, –4). The minimum value of the function occurs at the vertex and has a value of –4.

Figure 5. Features of a parabola
Example 1
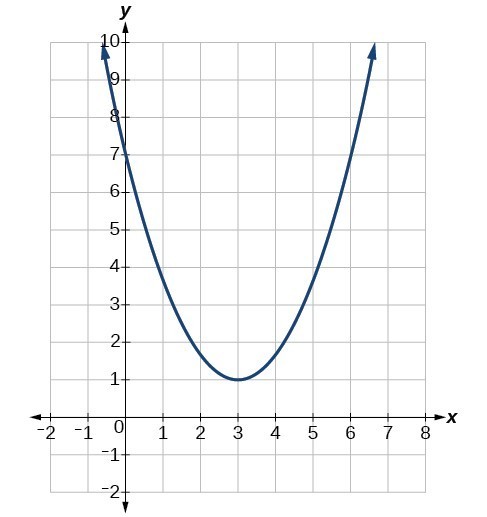
Determine the vertex, line of symmetry, [latex]x[/latex]-intercepts, [latex]y[/latex]-intercept and minimum value of the parabola.
 Solution
The graph crosses the [latex]y[/latex]-axis at 7, so the [latex]y[/latex]-intercept is (0, 7).
The graph never crosses the [latex]x[/latex]-axis, so there are no [latex]x[/latex]-intercepts.
The graph turns at (3, 1) so the vertex is (3, 1).
The graph has a minimum value at the vertex of 1.
The axis of symmetry is the vertical line through the vertex (3, 1), so is the line [latex]x=3[/latex].
Try It 1
Determine the vertex, line of symmetry, [latex]x[/latex]-intercepts, [latex]x[/latex]-intercept and maximum value of the parabola.

Identifying Symmetric Points
Since the graph of a quadratic function is symmetric across the line of symmetry, every point on the graph has a reflection called its symmetric point. Given any point [latex]A[/latex] on a parabola, the symmetric point [latex]A^{\prime}[/latex] of the given point [latex]A[/latex] will be on the other side of the line of symmetry, the same distance from the line of symmetry as the distance of point [latex]A[/latex] from the line of symmetry. Since the line of symmetry is vertical, the point [latex]A[/latex] and [latex]A^{\prime}[/latex] lie on the same horizontal line that is perpendicular to the line of symmetry. Therefore, the point [latex]A^{\prime}[/latex] has the same [latex]y[/latex]-coordinate as the given point [latex]A[/latex] (figure 6).
Figure 6. Move point P to see its symmetric point.
Example 2
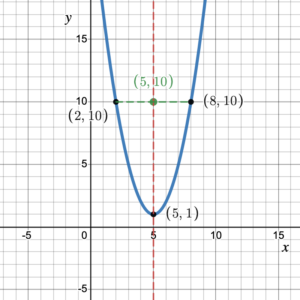
Find the symmetric point of a given point (2, 10) on a parabola with vertex (5, 1).
Solution
Draw a quick sketch of a parabola with its vertex at (5, 1) and that passes through the point (2, 10).
On the graph of the quadratic function, we have the line of symmetry [latex]x=5[/latex] passing through the vertex.

The symmetric point of (2, 10) will be on the other side of the line of symmetry where the [latex]y[/latex]-coordinate of the symmetric point will share the same [latex]y[/latex]-value of 10.
What is left now is to find the [latex]x[/latex]-coordinate of the symmetric point.
The distance between the given point (2, 10) and the line of symmetry [latex]x=5[/latex] is 3 (i.e., 5 – 2 = 3).
So starting at [latex]x=5[/latex] and moving to the right 3 units gives us the [latex]x[/latex]-coordinate of the symmetric point, 8 (i.e., 5 + 3 = 8).
Therefore, the symmetric point of the given point (2, 10) is (8, 10).
Try It 2
Find the symmetric point of a given point (0, –4) on a parabola with vertex (–3, 5).
Finding the [latex]x[/latex]-coordinate of the Vertex Using Two Symmetric Points
Any two symmetric points on a parabola are the same distance away from the line of symmetry. Consequently, any two symmetric points are the same distance away from the [latex]x[/latex]-coordinate of the vertex. Therefore, the [latex]x[/latex]-coordinate of the vertex is the midpoint between any two symmetric points on a parabola. This means that we can identify the [latex]x[/latex]-coordinate of the vertex if we know two symmetric points on a parabola. To find the halfway point between two given values, [latex]x_1[/latex] and [latex]x_2[/latex], we find the mean (or average) of the values: [latex]\dfrac{x_1+x_2}{2}[/latex]. To find the corresponding [latex]y[/latex]-coordinate of the vertex, we need the function equation so we can find the function value at the vertex.
For example, given two symmetric points (2, 10) and (8, 10) on the graph of the function [latex]f(x)=x^2-10x+26[/latex], the [latex]x[/latex]-coordinate of the vertex will be halfway between the two symmetric points (figure 7).

Figure 7. Axis of symmetry is halfway between two symmetric points.
The halfway point between [latex]x=2[/latex] and [latex]x=8[/latex] is:
[latex]x=\dfrac{2+8}{2} = \dfrac{10}{2} = 5[/latex]
Knowing that the [latex]x[/latex]-coordinate of the vertex is 5, the [latex]y[/latex]-coordinate of the vertex will be [latex]f(5)[/latex]:
[latex]\begin{aligned}f(5) &= (5)^2-10(5)+26 \\&= 25 - 50 + 26 \\&= 1\end{aligned}[/latex].
Therefore, the vertex of the function is at the point (5, 1).
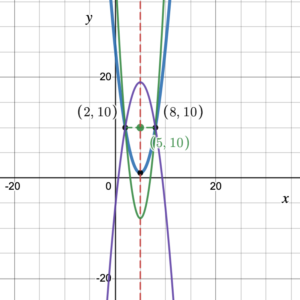
Note. If we did not know the equation of the function, or were unable to find the equation, we would not have been able to determine the [latex]y[/latex]-coordinate of the vertex. This is because there are an infinite number of parabolas that pass through the two symmetric points (2, 10) and (8, 10) (figure 8).

Figure 8. Example of parabolas that pass through (2, 10) and (8, 10)
Example 3
Find the vertex of the parabola representing the function [latex]f(x)=x^2-8x+13[/latex], which passes through the symmetric points (2, 1) and (6, 1).
Solution
The axis of symmetry is halfway between [latex]x=2[/latex] and [latex]x=6[/latex]:
[latex]x=\dfrac{2+6}{2}=4[/latex]
Therefore, the [latex]x[/latex]-coordinate of the vertex is 4.
To find the [latex]y[/latex]-coordinate of the vertex, we need to find [latex]f(4)[/latex]:
[latex]\begin{aligned}f(4)&=(4)^2-8(4)+13\\&=16-32+13\\&=-3\end{aligned}[/latex]
The vertex is the point (4, –3).
Try It 3
Find the vertex of the parabola representing the function [latex]f(x)=-x^2-6x-3[/latex], which passes through the symmetric points (–7, –10) and (1, –10).
Finding the Domain and Range of a Quadratic Function
Any number can be the input value of a quadratic function. Therefore the domain of any quadratic function is all real numbers. Because parabolas have a maximum or a minimum at the vertex, the range is restricted. Since the [latex]y[/latex]-coordinate of the vertex of a parabola will be either a maximum or a minimum, the range will be determined by the [latex]y[/latex]-coordinate of the vertex and whether or not the parabola opens upwards or downwards. If the parabola opens upwards, the range will consist of all [latex]y[/latex]-values greater than or equal to the [latex]y[/latex]-coordinate of the vertex. If the parabola opens downwards, the range will consist of all [latex]y[/latex]-values less than or equal to the [latex]y[/latex]-coordinate of the vertex.
Domain and Range of a quadratic function
For any quadratic function whose graph has a vertex at the point [latex](h, k)[/latex], the domain is all real numbers and the range depends on the whether the parabola opens up or down.
| Domain of Parabola Opening Down | Domain of Parabola Opening Up |
|---|---|

Domain = [latex](-\infty,+\infty)[/latex] Range = [latex](-\infty,k][/latex] |

Domain = [latex](-\infty,+\infty)[/latex] Range = [latex][k,+\infty)[/latex] |
Example 4
State the domain and the range of a quadratic function whose graph is a parabola that opens downwards with a vertex at the point (–2, 5).
Solution
First we should recognize that there are an infinite number of parabolas that opens downwards with a vertex at the point (–2, 5)! However, they all have the same domain and range.
The domain is all real numbers: [latex]x\in(-\infty,+\infty)[/latex]
Because the parabola opens downwards it has a maximum value at the vertex. So the range is all real numbers less than or equal to 5: [latex]y\in(-\infty,5][/latex]
Try It 4
State the domain and the range of a quadratic function whose graph is a parabola that opens upwards with a vertex at the point (4, –3).
Candela Citations
- Graph the Quadratic Function f(x)=x^2. Authored by: Leo Chang and Hazel McKenna. Provided by: Utah Valley University. License: CC BY: Attribution
- Identify a Symmetric Point. Authored by: Leo Chang and Hazel McKenna. Provided by: Utah Valley University. License: CC BY: Attribution
- Find the x-coordinate of the Vertex Using Two Symmetric Points. Authored by: Leo Chang and Hazel McKenna. Provided by: Utah Valley University. License: CC BY: Attribution
- Revision and Adaptation. Provided by: Lumen Learning. License: CC BY: Attribution
- Figure 1. Vertex and Axis of Symmetry Interactive. Authored by: Hazel McKenna. Provided by: Utah Valley University. Located at: https://www.desmos.com/calculator/xwvxml2h7z. License: CC BY: Attribution
- Figure 6. Symmetric points interactive. Authored by: Hazel McKenna. Provided by: Utah Valley University. Located at: https://www.desmos.com/calculator/szdua4agki. License: CC BY: Attribution
- Figures 2, 3, 4, 6, 7, 8. All Examples. All Try Its: hjm768, hjm048, hjm947, hjm 202. Authored by: Hazel McKenna. Provided by: Utah Valley University. License: CC BY: Attribution
- All graphs created using desmos graphing calculator. Authored by: Hazel McKenna and Leo Chang. Provided by: Utah Valley University. License: CC BY: Attribution
- College Algebra. Authored by: Abramson, Jay et al.. Provided by: OpenStax. Located at: http://cnx.org/contents/9b08c294-057f-4201-9f48-5d6ad992740d@5.2. License: CC BY: Attribution. License Terms: Download for free at http://cnx.org/contents/9b08c294-057f-4201-9f48-5d6ad992740d@5.2
