Learning Objectives
- Identify different types of graphs
- Points
- Lines
- Curves
- Identify features of graphs
- [latex]x[/latex]-intercepts and [latex]y[/latex]-intercept
- Maximum and minimum function values
- Local maximums and minimums
- Symmetry
- Asymptotes
- Domain and range
- Intersection points
Types of Graphs
The graph of a function can take on many shapes. It may be a line (Figure 1) or a curve (Figure 2). However, it could also be a line segment (Figure 3) or just points on the coordinate plane (Figure 4).
|
Linear
|
Quadratic
|
|---|---|

Figure 1. Function as a line. |

FIgure 2. Function as a curve. |
|
line segment
|
points
|
|---|---|

Figure 3. Function as a line segment. |

Figure 4. Function as points. |
The graph of a line segment has endpoints. When the endpoints are included in the graph they are solid, like the ones in figure 3. When the endpoints are open circles, they are excluded from the graph. Both the domain and the range of the function in figure 3 are [latex][1, 6][/latex], but they are different sets. The domain consists of values of [latex]x[/latex], and the range consists of values of [latex]f(x)[/latex].
When a function is graphed as a set of points, it can be written as a set of ordered pairs. The function in figure 4 can be written, [latex]f(x)=\{ (-2, -2), (1, 1), (2, 2), (3, 3), (6, 6)\}[/latex]. Here the domain is the set of [latex]x[/latex]-values [latex]\lbrace -2, 1, 2, 3, 6\rbrace[/latex] while the range is the set of function values [latex]\lbrace -2, 1, 2, 3, 6\rbrace[/latex]. Even though the sets have the same elements, they represent different things i.e. the domain ([latex]x[/latex]-values) and the range ([latex]f(x)[/latex]-values).
Example 1
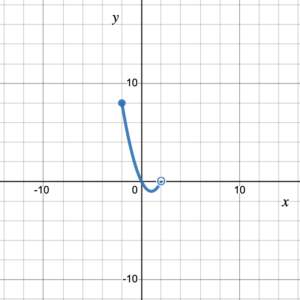
State the domain of the graphed function:
Solution
The graph starts at (and includes) the point (–2, 8) and ends at (but does not include) the point (2, 0).
SInce the domain is the set of [latex]x[/latex]-values, the domain is the set of all [latex]x[/latex]-values between –2 (included) and 2 (not included).
Domain = [–2, 2)
Try It 1
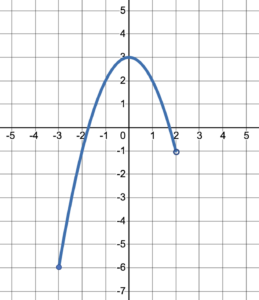
State the domain and range of the graphed function:
Continuous and Non-continuous Graphs
Continuous graphs are graphs where there is a value of [latex]y[/latex] for every value of [latex]x[/latex], and each point is immediately next to the point on either side of it so that the line of the graph is uninterrupted (e.g., figure 5). In other words, if the line is continuous, the graph is continuous. On the other hand, a graph is non-continuous if there is any break in the graph (e.g., figure 6). There is a break in the graph at [latex]x=0[/latex]. In other words, if we can draw the graph without taking the pen off the paper, the graph is continuous. Otherwise, it is non-continuous.
|
No breaks
|
A break at x=0
|
|---|---|
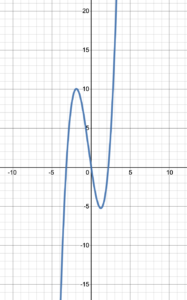
Figure 5. A continuous graph. |

Figure 6. A non-continuous graph. |
Try It 2
Determine if the graph is continuous or not continuous.

Features of Graphs
[latex]x[/latex]– and [latex]y[/latex]-Intercepts
There are some features of graphs that attract our attention. First, we are interested in the intersection point(s) between the graph and the [latex]x[/latex]-axis. These intersection points are called [latex]x[/latex]-intercepts. We are also interested in the intersection point between the graph and the [latex]y[/latex]-axis; the [latex]y[/latex]-intercept. Figure 7 shows the graph of a function with two [latex]x[/latex]-intercepts at (1, 0) and (3, 0) and one [latex]y[/latex]-intercept at (0, 3). Any time the graph represents a function, there can only be at most one [latex]y[/latex]-intercept. Do you see why?
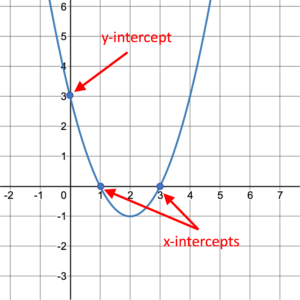
Figure 7. Function with [latex]x[/latex]– and [latex]y[/latex]-intercepts.
Try It 3
Identify the [latex]x[/latex]– and [latex]y[/latex]-intercepts on the graph.
Maximum and Minimum Values and Turning Points
The maximum and minimum values of a function are also interesting features of a graph. Sometimes the maximum or minimum values of a function occur at turning points. For the graph in Figure 8, the turning point of the purple graph on the left is at point [latex](–2, 2)[/latex]. Therefore, the maximum value of this function is 2. The turning point of the green graph on the right is [latex](5, –3)[/latex]. It shows the minimum value of the function, –3.
|
One turning point
|
Two turning points
|
|---|---|
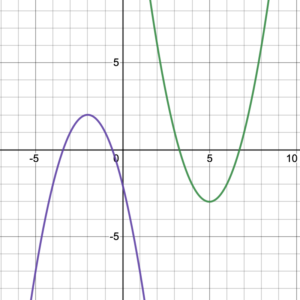
Figure 8. Turning points. |

Figure 9. Function with two turning points. |
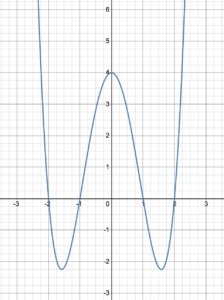
The graph in figure 9 has two turning points, but neither of these points are maximum or minimum values of the function. Indeed, the range of the function is [latex](-\infty, +\infty)[/latex] so the graphs have no maximum or minimum. The turning points on the graph in figure 9 are referred to as a local maximum and a local minimum. They show maximum and minimum values within a certain set of [latex]x[/latex]-values. For example, the graph of the function in figure 9, has a local minimum value of zero in the domain [latex][-4, 4][/latex] and a local maximum in the domain [latex][-9, -5][/latex].
When there are local maxima and minima on a graph, we call the overall maximum and minimum of the function the global maximum and global minimum.
Try It 4
Identify the global maximum and minimum values of the function on the graph.
Symmetry
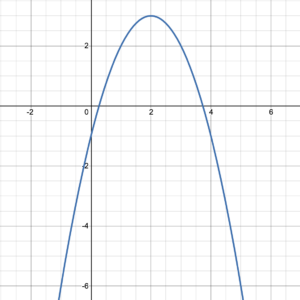
A graph of a function is symmetrical is there is a line of symmetry such that the image of one side is the reflection of the image of the other side regarding the line of symmetry. The graph in Figure 7 is symmetrical about the vertical line [latex]x = 2[/latex]. The graphs in Figure 8 are symmetrical about vertical the line [latex]x = –2[/latex] for the purple graph on the left and the vertical line [latex]x = 5[/latex] for the graph on the right. The graph in figure 9 has no line of symmetry.
Not all lines of symmetry are vertical. Figure 10 shows the graph of a function that does not have a vertical line of symmetry. However, it does have a line of symmetry; the line [latex]y=x[/latex]. For example, the points (1, 6) and (6, 1) both lie on the graph and are mirror images of one another across the line the line [latex]y=x[/latex].
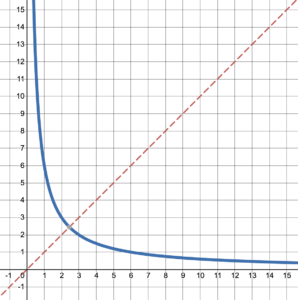
Figure 10. Graph with line of symmetry [latex]y=x[/latex].
Try It 5
Determine the line of symmetry.

Asymptotes
A vertical asymptote is a vertical line that the graph continually approaches as close as it can get but never actually crosses. At a vertical asymptote the graph gets closer to either positive or negative infinity. A horizontal asymptote is a horizontal line that the graph continually approaches as close as it can get as [latex]x[/latex] gets closer and closer to either positive or negative infinity.
For example,the graph in figure 11 has a vertical asymptote at [latex]x=-2[/latex]. [latex]x[/latex] never reaches –2, but as it gets closer and closer to –2, [latex]f(x)[/latex] gets closer to [latex]-\infty[/latex]. The graph in figure 12 has a horizontal asymptote at [latex]y=-4[/latex]. [latex]f(x)[/latex] never reaches –4, but as [latex]x[/latex] gets closer to [latex]-\infty[/latex], [latex]f(x)[/latex] gets closer and closer to –4.
|
A logarithmic function
|
An exponential function
|
|---|---|
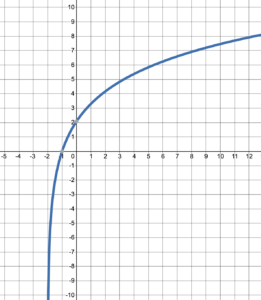
Figure 11. Graph of a function with a vertical asymptote. |
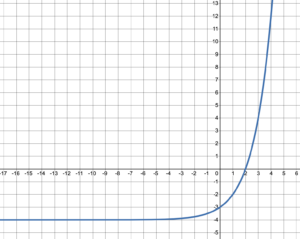
Figure 12. Graph of a function with a horizontal asymptote. |
The graph in figure 13 has both horizontal and vertical asymptotes. The vertical lines [latex]x=-1[/latex] and [latex]x=4[/latex] are vertical asymptotes. Moving from left to right, the graph never makes it to [latex]x=-1[/latex] but gets incredibly close as [latex]f(x)[/latex] veers towards infinity. On the other side of [latex]x=-1[/latex] coming from right to left, the graph never makes it to the asymptote [latex]x=-1[/latex] as [latex]f(x)[/latex] veers towards negative infinity. The other vertical asymptote is at [latex]x=4[/latex]. Vertical asymptotes are never crossed.

Figure 13. Graph with asymptotes.
In figure 13, there is also a horizontal asymptote at [latex]y=3[/latex]. As [latex]x[/latex] gets closer to either positive or negative infinity, the graph gets closer and closer to the line [latex]y=3[/latex].
Horizontal asymptotes can be crossed as the graph of the function in figure 14 shows. The vertical asymptotes are the lines [latex]x=-4[/latex] and [latex]x=2[/latex], and they are never crossed. The horizontal asymptote is the line [latex]y=3[/latex]. As [latex]x[/latex] gets closer and closer to positive or negative infinity, the graph gets closer and closer to [latex]y=3[/latex]. Notice that the graph crosses the horizontal asymptote at the point [latex](0, 3)[/latex].

Figure 14. Horizontal asymptotes can be crossed.
Try It 6
Determine the horizontal and vertical asymptotes of the graphed function:

Multiple Graphs
If there are two or more graphs on the coordinate plane, we may be interested in their intersection point(s). Figure 15 shows that the intersection point of the two lines is (1, 3), while figure 16 shows two intersection points at (–3, 6) and (2, –1) of the two functions.
|
One intersection point
|
Two intersection points
|
|---|---|
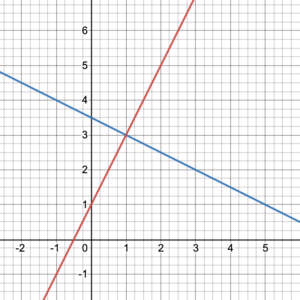
Figure 15. Intersection of two functions at one point. |

Figure 16. Intersection of two functions at two points. |
Tr-3,-5)y It 7
State the intersection points of the two functions on the graph.

Candela Citations
- Graphs of Functions. Authored by: Leo Chang and Hazel McKenna. Provided by: Utah Valley University. License: CC BY: Attribution
- All graphs created using desmos graphing calculator. Authored by: Hazel McKenna & Leo Chang. Provided by: Utah Valley University. Located at: https://www.desmos.com/calculator. License: CC BY: Attribution
