Learning Objectives
- Describe rate-initial value form of a linear function
- Describe slope-intercept form of a linear function
- Write the slope-intercept form of a graphed linear function
- Identify the domain and range of a linear function
Rate-Initial Value Form of a Linear Function
Every linear pattern may be represented or modeled by a linear function. Table 1 shows a linear pattern where [latex]y[/latex] increases by 3 as [latex]x[/latex] increases by 1.
| Table 1. A linear pattern of [latex]y[/latex] as a function of [latex]x[/latex]. | |||||||
| Linear Pattern of y Increasing by 3 as x Increases by 1 | |||||||
|---|---|---|---|---|---|---|---|
| [latex]x[/latex] | -3 | -2 | -1 | 0 | 1 | 2 | 3 |
| [latex]y[/latex] | -8 | -5 | -2 | 1 | 4 | 7 | 10 |
This means that the rate of change of the pattern in table 1 is 3. Therefore, the relationship between [latex]x[/latex] and [latex]y[/latex] must include the term [latex]y = 3x[/latex] to describe the pattern, since [latex]y[/latex] increases by 3 as [latex]x[/latex] increases by 1. However, the equation [latex]y = 3x[/latex] is not quite right since if we plug in 1 for [latex]x[/latex], we get [latex]y=3[/latex] when [latex]y[/latex] is in fact equal to 4, according to table 1. To get from 3 to 4 we must add 1, so let’s consider the equation [latex]y=3x+1[/latex] as the representation of the pattern. We can try this new equation out on a couple of data points. When [latex]x=2[/latex], the equation tells us that [latex]y=3x+1=3(2)+1=7[/latex], which is correct according to table 1. When [latex]x=-3[/latex], the equation tells us that [latex]y=3x+1=3(-3)+1=-8[/latex], which is also correct. We can go on to confirm that each [latex]y[/latex]-value in table 1 can be found from an [latex]x[/latex]-value using the equation [latex]y=3x+1[/latex].
Our first attempt at finding an equation, [latex]y=3x[/latex] didn’t work because the value when [latex]x = 0[/latex] is not 0. The value when [latex]x = 0[/latex] is 1. Therefore, we had to add the value of 1 to [latex]3x[/latex] to get [latex]y = 3x+1[/latex]. The function form of this equation is [latex]f(x) = 3x + 1[/latex].
RATE-INITIAL VALUE FORM OF A FUNCTION
Every linear pattern can be described by a function of the form:
dependent variable = (rate of change) · (independent variable) + initial value
where initial value is defined as the value of the dependent variable when the independent variable equals zero.
Recall that the rate of change is the change in dependent variable divided by the change in the independent variable. Since this is a lot of verbiage to write every time we are finding a rate of change, we use the Greek capital letter delta, [latex]\Delta[/latex], to represent “change in”. So “change in [latex]y[/latex]” is written [latex]\Delta y[/latex] and “change in [latex]x[/latex]” is written [latex]\Delta x[/latex]. This greatly simplifies the rate of change to [latex]\dfrac{\Delta y}{\Delta x}[/latex].
Example 1
Write an equation for the linear pattern described in the table.
| Data for a Linear Equation | |||||
|---|---|---|---|---|---|
| [latex]x[/latex] | 0 | 1 | 2 | 3 | 4 |
| [latex]y[/latex] | 5 | 3 | 1 | –1 | –3 |
Solution
The initial value at [latex]x=0[/latex] is 5.
The rate of change = [latex]\frac{\Delta y}{\Delta x}=\frac{-2}{1}=-2[/latex]
Equation: dependent variable = (rate of change) · (independent variable) + initial value
[latex]y=-2x+5[/latex]
Try It 1
Write an equation for the linear pattern described in the table.
| Data for a Linear Equation | |||||
|---|---|---|---|---|---|
| [latex]x[/latex] | –2 | –1 | 0 | 1 | 2 |
| [latex]y[/latex] | –8 | –5 | –2 | 1 | 4 |
Slope-Intercept Form of a Function
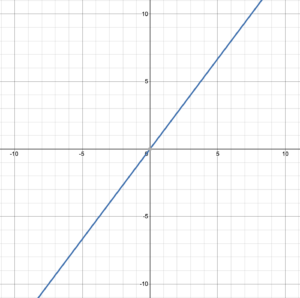
In the context of graphing, the constant rate of change is called the slope. For a linear function, the graph is a line which has a constant slope. Earlier we saw that the pattern in table 1 can be represented by the function [latex]f(x)=3x+1[/latex], where 3 was the rate of change and 1 was the initial value. Since the rate of change was 3, the slope of the line that represents this function, [latex]y=3x+1[/latex], is also 3. That is, the slope is [latex]\dfrac{3}{1}=\dfrac{rise}{run}[/latex]. The table value [latex]y = 1[/latex] when [latex]x = 0[/latex] is represented by the point (0, 1) on the coordinate plane. This point is the y-intercept of the line that represents the function and shows the initial value of the function. Therefore, the function of rate-initial value form
[latex]f(x) = 3x + 1[/latex]
is also called the Slope-Intercept Form because the rate of change 3 is the slope, and the initial value 1 is the [latex]y[/latex]-coordinate of the [latex]y[/latex]-intercept.
The graph of [latex]f(x)=3x+1[/latex] is shown in figure 1. To illustrate, starting at the [latex]y[/latex]-intercept (0, 1), the line rises 3 (moving up 3 units) as it runs 1 (moving right 1 unit).

Figure 1. Graph of [latex]f(x)=3x+1[/latex]
SLOPE-INTERCEPT FORM OF A FUNCTION
Every line that represents a linear function on the coordinate plane can be written: [latex]y=mx+b[/latex],
where [latex]m[/latex] = slope of the line, and [latex]b[/latex] is the [latex]y[/latex]-coordinate of the [latex]y[/latex]-intercept.
A linear function in slope-intercept form is: [latex]f(x) = mx + b[/latex]
Example 2
The graph of the function [latex]f(x)=4x-2[/latex] is a line. In the graphical representation of this function, what is the slope of the line, and what is the [latex]y[/latex]-intercept?
Solution
[latex]f(x)=4x-2[/latex] is graphed as the equation [latex]y=4x-2[/latex]. This is in the form [latex]y=mx+b[/latex]. So, [latex]m=4[/latex] and [latex]b=-2[/latex]. This means that the slope of the line is 4 and the [latex]y[/latex]-intercept is the point (0, –2).
Try It 2
The graph of the function [latex]f(x)=-3x+7[/latex] is a line. In the graphical representation of this function, what is the slope of the line, and what is the [latex]y[/latex]-intercept?
Example 3
The graph of a function is a line with a slope of 5 and a [latex]y[/latex]-intercept at the point (0, –6). What function does this represent?
Solution
The function is [latex]f(x) = mx + b[/latex] with [latex]m=5[/latex] and [latex]b=–6[/latex].
So, [latex]f(x) = 5x -6[/latex]
Try It 3
The graph of a function is a line with a slope of [latex]\frac{3}{4}[/latex] and a [latex]y[/latex]-intercept at the point (0, 3). What function does this represent?
Slope-Intercept Form on the Coordinate Plane
We can write the function represented by a line on the coordinate plane as long as the slope and [latex]y[/latex]-intercept can be identified on the graph.
There are two lines graphed in figure 2. The black line has a [latex]y[/latex]-intercept at the point (0, 3) and a slope of 3 [latex]\left ( m=\frac{\Delta y}{\Delta x}=\frac{3-(-9)}{0-(-4)}=\frac{12}{4}=3 \right )[/latex]. Therefore, the function of the black line is [latex]f(x) = 3x + 3[/latex]. The black line has a [latex]y[/latex]-intercept at (0, –5), and its slope is [latex]-\frac{3}{10}[/latex] [latex]\left ( m=\frac{\Delta y}{\Delta x}=\frac{-2-(-5)}{-10-(0)}=\frac{3}{-10}=-\frac{3}{10} \right )[/latex]. Therefore, the function of the black line is [latex]g(x) = -\frac{3}{10}x -5[/latex].

Figure 2. Two lines on the coordinate plane.
Be careful not to confuse the [latex]x[/latex]-intercept and the [latex]y[/latex]-intercept. The “intercept” in the term “Slope-intercept form” means the [latex]y[/latex]-intercept. The [latex]x[/latex]-intercept is the intersection point between a graph (e.g., a line) and the [latex]x[/latex]-axis. Because the intersection point is on the [latex]x[/latex]-axis, its coordinates will be [latex](a, 0)[/latex]. For the blue line in figure 2, the [latex]x[/latex]-intercept is the point (-1, 0).
Example 4
Determine the [latex]y[/latex]-intercept and slope of the graphed line. Then write the function the line represents.
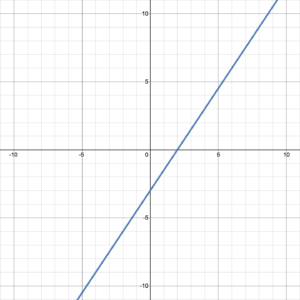
Solution
The [latex]y[/latex]-intercept is the point where the line intersects the [latex]y[/latex]-axis: (0, –3).
The slope can be found between any two points in the graph: (0, –3) and (2, 0) lie on the graph, so [latex]m=\frac{\Delta y}{\Delta x}=\frac{0-(-3)}{2-0}=\frac{3}{2}[/latex].
The function represented by the line takes the form [latex]f(x)=mx+b[/latex], so [latex]f(x)=\frac{3}{2}x-3[/latex].
Try It 4
Determine the [latex]y[/latex]-intercept and slope of the graphed line. Then write the function the line represents.
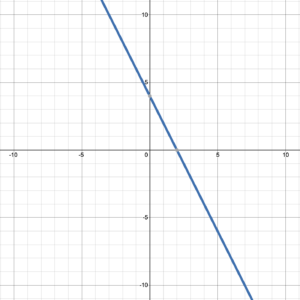
Example 5
Determine the [latex]y[/latex]-intercept and slope of the graphed line. Then write the function the line represents.
Solution
The line crosses the [latex]y[/latex]-axis at (0, 7), so the [latex]y[/latex]-intercept = (0, 7).
The line is horizontal so the slope is zero. Using two points on the line (0, 7) and (1, 7) slope = [latex]\frac{7-7}{1-0}=0[/latex].
The function takes the form [latex]f(x)=mx+b[/latex] so [latex]f(x)=0x+7[/latex], which simplifies to [latex]f(x)=7[/latex].
Note: all horizontal lines have a slope of zero, so represent a function of the form [latex]f(x)=b[/latex], where [latex](0, b)[/latex] is the [latex]y[/latex]-intercept.
Try It 5
Determine the [latex]y[/latex]-intercept and slope of the graphed line. Then write the function the line represents.

The Domain and Range of a Line
We have seen that the graph of a linear function is a line on the coordinate plane. For any line that is neither horizontal nor vertical (see figure 3), it extends to the left toward an [latex]x[/latex]-value of negative infinity and right towards an [latex]x[/latex]-value of positive infinity. Therefore, its domain, which is the set of all [latex]x[/latex]-values, is [latex]\{\;x\;|\;x\in(-\infty, \infty)\;\}[/latex]. It also extends down towards a [latex]y[/latex]-value of negative infinity and up towards a [latex]y[/latex]-value of positive infinity. Therefore, its range, which is the set of all [latex]y[/latex]-values, is [latex]\{\;f(x)\;|\;f(x)\in(-\infty, \infty)\;\}[/latex].
Figure 3. Graph of a line.
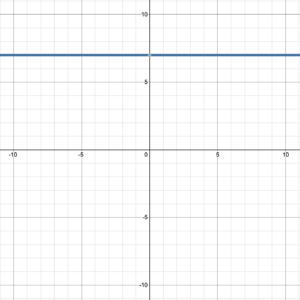
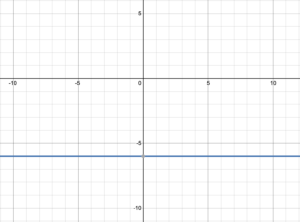
For a horizontal line, the domain is [latex]\{ \;x\;|\;x\in (-\infty, \infty)\}[/latex] because it extends to the left and right on the coordinate plane. However, its range will be a single function-value because all of the points on the horizontal line have the same [latex]y[/latex]-coordinate. For example, the range of the horizontal line in the figure 4 is [latex]\{\;f(x)\;|\;f(x)=3\;\}[/latex].
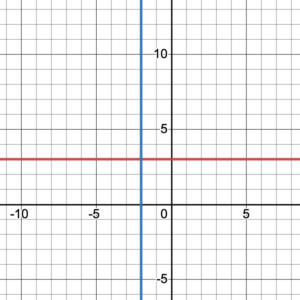
Figure 4. A horizontal line and a vertical line.
A vertical line, like the blue line in figure 4, is NOT a function. Do you see why?
However, it is a relation and therefore has a domain and a range. Its domain will be a single [latex]x[/latex]-value because all of the points on the vertical line have the same [latex]x[/latex]-coordinate. For example, the domain of the vertical line in figure 4 is [latex]\{ \;x\;|\;x=–2\;\}[/latex]. The range is [latex]\{ \;y\;|\;y\in (-\infty, \infty)\;\}[/latex] because it extends up towards a [latex]y[/latex]-value of positive infinity and down towards a [latex]y[/latex]-value of negative infinity.
Example 6
Determine the domain and range of the function represented by the graph:
Solution
The line extends to positive and negative infinity in both [latex]x[/latex] and [latex]y[/latex] directions, so the domain is [latex]\{\;x\;|\;x\in(-\infty, \infty)\}[/latex] and the range is [latex]\{\;f(x)\;|\;f(x)\in(-\infty, \infty)\;\}[/latex]
Try It 6
Determine the domain and range of the function represented by the graph:
Candela Citations
- Linear Functions. Authored by: Hazel McKenna and Leo Chang. Provided by: Utah Valley University. License: CC BY: Attribution
- All graphs created using desmos graphing calculator. Authored by: Leo Chang and Hazel McKenna. Provided by: Utah Valley University. Located at: http://www.desmos.com/calculator. License: CC BY: Attribution