Learning Outcomes
- Use the vertical line test to determine if a graph represents a function
- Use the horizontal line test to determine if a graphed function is one-to-one
Functions as Graphs
As we saw in the previous section, functions can be represented by graphs. Graphs are useful as they display many input-output pairs in a small space and the visual information they provide can make relationships clearer. We typically construct graphs with the domain values along the horizontal axis and the range values along the vertical axis. This is because the domain values (e.g. [latex]x[/latex]) are independent and independent variables are generally associated with the horizontal axis. The values in the range are called function values and are dependent on the domain values and are therefore associated with the vertical axis.
Since the rectangular coordinate system is most commonly associated with an [latex]x[/latex]-axis and a [latex]y[/latex]-axis, along with coordinate pairs [latex](x, y)[/latex], it is common when first learning functions to name the domain values [latex]x[/latex] and the function values [latex]y[/latex], and we say [latex]y[/latex] is a function of [latex]x[/latex], or [latex]y=f\left(x\right)[/latex] when the function is named [latex]f[/latex]. The graph of the function is the set of all points [latex]\left(x,y\right)[/latex] in the plane that satisfies the equation [latex]y=f\left(x\right)[/latex]. If the function is defined for only a few input values, then the graph of the function is only a few points, where the [latex]x[/latex]-coordinate of each point is a domain value and the [latex]y[/latex]-coordinate of each point is the corresponding function value.
In other words, if [latex]y=f(x)[/latex], then the coordinates of any point on the graph of [latex]y=f(x)[/latex] are of the form [latex]\left (x, f(x)\right )[/latex]. For example, the coordinates of the black dots on the graph in figure 1 are (0, 2) and (6, 1). This tells us that the function value when [latex]x=0[/latex] is 2, and the function value when [latex]x=6[/latex] is 1. In function notation, this is written [latex]f(0)=2[/latex] and [latex]f(6)=1[/latex]. The points [latex](0, 1)[/latex] and [latex](6, 1)[/latex] are only two points on the graph. The graph of the set of all points [latex]\left(x,f(x)\right)[/latex] is a curve. The curve shown includes [latex]\left(0,2\right)[/latex] and [latex]\left(6,1\right)[/latex] because the curve passes through those points.
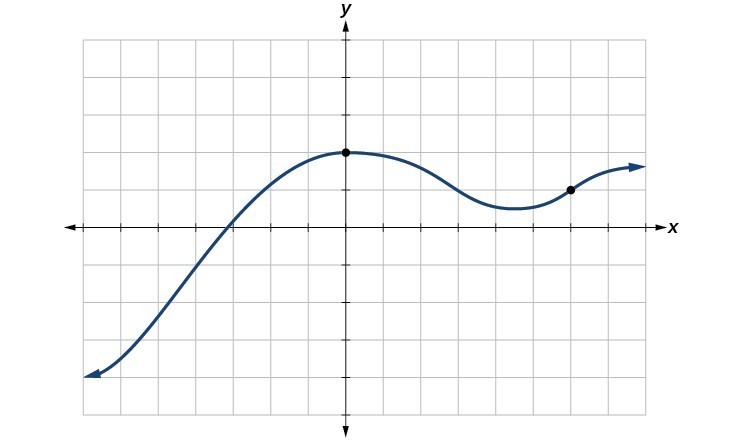
Figure 1. Graph of a function
Some Graphs Are Not Functions
Any function [latex]y=f(x)[/latex] can be represented by a graph. However, every graph does not represent a function. Remember that a function is a relation with a one-to-one or many-to-one mapping. All graphs represent relations, but that relation may not be a function.
Consider the graph in figure 1. Choose any [latex]x[/latex]-value and it is clear that it has a single corresponding [latex]y[/latex]-value. There is no [latex]x[/latex]-value that maps to two or more [latex]y[/latex]-values. That is the definition of a function. Now consider the graph in figure 2.

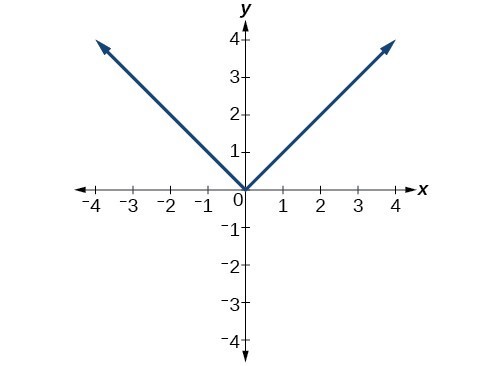
Figure 2. Graph does not represent a function
The only [latex]x[/latex]-value that has a single [latex]y[/latex]-value is [latex]x=-4[/latex]. Any other [latex]x[/latex]-value we choose has 2 [latex]y[/latex]-values. This means that the mapping of [latex]x[/latex] to [latex]y[/latex] is one-to-many and therefore this graph does not represent a function.
The Vertical Line Test
The vertical line test can be used to determine whether a graph represents a function. A vertical line includes all points with a particular [latex]x[/latex]-value. If we can draw any vertical line that intersects a graph more than once, then the graph does not define a function because that [latex]x[/latex] value has more than one [latex]y[/latex]-value. For each [latex]x[/latex]-value in the domain, a function has only one [latex]y[/latex]-value (or function value) in the range.
the vertical line test
The vertical line test can be used to determine of a graph represents a function.
- Inspect the graph to see if any vertical line drawn would intersect the curve more than once.
- If any vertical line intersects the graph more than once, the graph does NOT represent a function.
- If any vertical line intersects the graph only once, the graph does represent a function.
Example 1
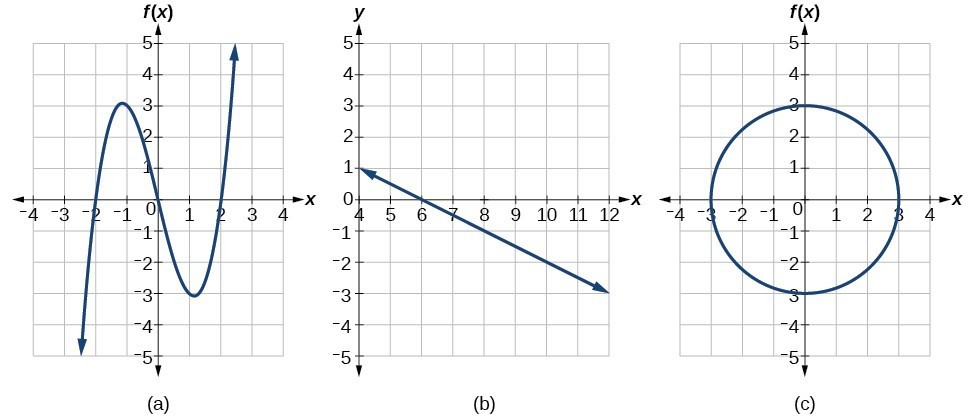
Which of the graphs represent(s) a function [latex]y=f\left(x\right)?[/latex]
Solution
If any vertical line intersects a graph more than once, the relation represented by the graph is not a function. Notice that any vertical line would pass through only one point of the two graphs shown in parts (a) and (b) above. From this we can conclude that these two graphs represent functions. The third graph, (c), does not represent a function because a vertical line intersects the graph at more than one point.
Try It 1
Does the graph represent a function?
try it 2
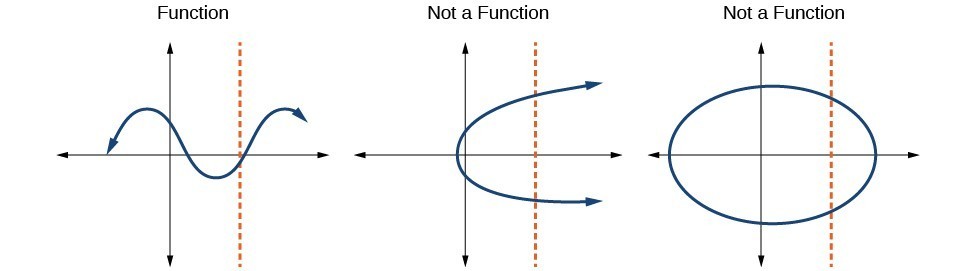
In the graph below, use the vertical line test to determine which relations are functions and which are not.

The Horizontal Line Test
In the previous section, we learned that a function is a relation with a one-to-one or many-to-one mapping. The vertical line test can tell us if a graph represents a function, but how will we know if that function is one-to-one? In order for a function to be one-to-one, not only does every [latex]x[/latex]-value map to only one [latex]y[/latex]-value but every [latex]y[/latex]-value is mapped from exactly one [latex]x[/latex]-value.
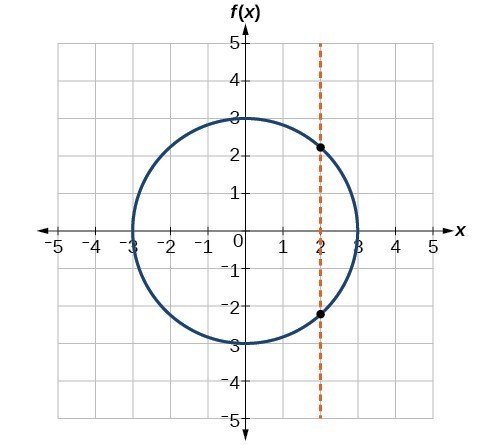
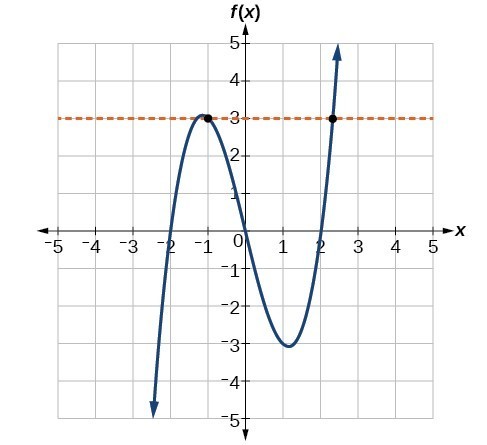
Consider the graph in figure 3. We can see it is a function as any vertical line passes through only one point. But is the function one-to-one? If we choose any [latex]y[/latex]-value, say [latex]y=4[/latex], we can see that the points [latex](-2, 4)[/latex] and [latex](2, 4)[/latex] both lie on the curve. This means that this function is not one-to-one as the [latex]y[/latex]-value 4 is mapped from two different [latex]x[/latex]-values, -2 and 2.

Figure 3. A function that is not one-to-one
Once we have determined that a graph defines a function, an easy way to determine if it is a one-to-one function is to use the horizontal line test. A horizontal line includes all points with a particular [latex]y[/latex]-value. If we can draw any horizontal line that intersects the graph more than once, then the graph does not represent a one-to-one function because that [latex]y[/latex] value is mapped from more than one [latex]x[/latex]-value.
How To: Given a graph of a function, use the horizontal line test to determine if the graph represents a one-to-one function.
- Inspect the graph to see if any horizontal line drawn would intersect the curve more than once.
- If there is any such line, the function is not one-to-one.
- If no horizontal line can intersect the curve more than once, the function is one-to-one.
Example 2
Determine if the graph represents a one-to-one function.
Solution
(a) The graph represents a function since any vertical line passes through only one point on the graph. But the function is not one-to-one. The horizontal line shown below intersects the graph of the function at two points (and we can even find horizontal lines that intersect it at three points.)
(b) The graph represents a one-to-one function as any vertical and horizontal lines pass through only one point on the graph.
(c) The graph does not represent a function as a vertical line can pass through more than one point. Since it is not a function, it cannot be a one-to-one function.;
Try It 3
Determine if the graph represents a one-to-one function.

Graph (a)

Graph (b)

Graph (c)
Candela Citations
- Revision and Adaptation. Authored by: Hazel McKenna and Leo Chang. Provided by: Lumen Learning. License: CC BY: Attribution