Learning Objectives
- Define a relation using ordered pairs, a mapping, a graph, and an equation
- Determine the domain and range of a relation
- Write the domain and range in interval notation
- Write the domain and range in set-builder notation
Relations
A relation is a way in which two or more objects are connected. For example, every person has a date of birth, so there is a relation between the person and their date of birth. Indeed, there is a relation between the set of all people and the set of all birth dates. Every perfect square has a whole number square root, so there is a relation between a perfect square and its whole number square root. Further, there is a relation between the set of perfect squares and the set of whole number square roots.
Mathematically, a binary relation is defined as a connection between two sets of objects. That relation can be represented in multiple ways: a set of ordered pairs; a mapping; a graph; or an equation.
For example, the relation between two whole numbers where the second number is double the first number, may be represented in different ways:
- A set of ordered pairs shows the first number followed by the second number, or the source followed by the target: {(0, 0), (1, 2), (2, 4), (3, 6), (4, 8),…}. The ellipses … show that the established pattern continues forever.
- A mapping shows the association of the first numbers (the set of whole numbers) with an arrow that points to the corresponding second number (double the first number):

- A graph shows the set of ordered pairs plotted on the rectangular (Cartesian) coordinate plane. If the first number is represented by [latex]x[/latex] and the second number by [latex]y[/latex], the graph shows the plotted points [latex](x, y)[/latex]. Obviously, the graph does not show all possible coordinate pairs as the whole numbers start at zero and go to infinity. Notice also, that the plotted pairs are not joined by a line, as the line that joins them represents real numbers, not whole numbers.

- An equation: If the first number is represented by [latex]x[/latex] and the second number by [latex]y[/latex], then since [latex]y[/latex] is double the value of [latex]x[/latex], the relation can be represented by the equation [latex]y = 2x[/latex] where [latex]x[/latex] is a whole number.
Example 1
The relation given by the set of ordered pairs {(Juan, Brown), (Ian, Blue), (Bailey, Brown), (Kirsty, Hazel), (Jean, Grey), (Freddy, Blue)} is the eye color of each named person. Create a mapping to show this relation.
Solution
We start by listing the elements of each set inside a border, then draw arrows from the person to their respective eye color.
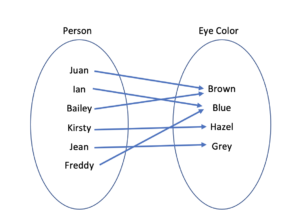
Notice that there are more people than colors, since some people share the same eye color.
Try It 1
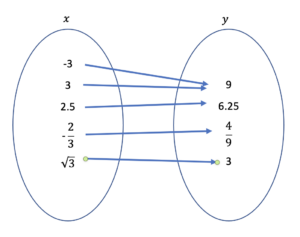
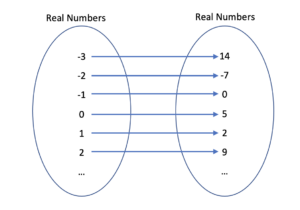
What relation is shown in the mapping?
Example 2
Graph the relation [latex]y=-x+3[/latex]
Solution
This relation is given in the form of a linear equation. To graph an equation we can use a table of values. Choose any [latex]x[/latex]-value and find the corresponding [latex]y[/latex]-value, then plot the ordered pairs.
| [latex]x[/latex] | [latex]y=-x+3[/latex] |
|---|---|
| -2 | [latex]y=-(-2)+3=5[/latex] |
| -1 | [latex]y=-(-1)+3=4[/latex] |
| 0 | [latex]y=-(0)+3=3[/latex] |
| 1 | [latex]y=-(1)+3=2[/latex] |
| 2 | [latex]y=-(2)+3=1[/latex] |
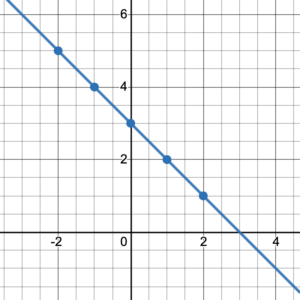
The equation [latex]y=-x+3[/latex] had no limitations on the values of [latex]x[/latex] so we can assume that it includes all real numbers. This means that we can join the dots to form a line that continues forever in both directions.
Try It 2
Use the graph to create a mapping from the set of real numbers to the set of real numbers.
Domain and Range
The word domain is used to refer to the set of elements of the source in a relation. The word range is used to refer to the set of elements of the target in a relation. For example, the domain in the relation between two whole numbers where the second number is double the first number is the set {0, 1, 2, 3, 4….}. The range in this relation is the set {0, 2, 4, 6, 8,…}.
When the relation is given as a set of ordered pairs, where the first element in the pair is mapped to the second element in the pair, the first element in the pair belongs to the domain, while the second element belongs to the range. For example, the pair (3, 5) means the element 3 in the domain is mapped to the element 5 in the range. For the set of ordered pairs {(1, 2), (4, 8), (5, -3), (4, 6)}, the domain is the set {1, 4, 5}, while the range is the set {2, 8, -3, 6}.
Try It 3
State the domain and the range of the relation {(-3, 2), (0, 3), (4, 2), (-3, 0)}.
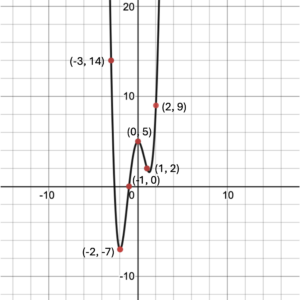
Every graph on a coordinate plane is composed of points which are ordered pairs. Therefore, the domain of the graph will be the set of the [latex]x[/latex]-coordinates of all the points on the graph and the range will be the set of the [latex]y[/latex]-coordinates of all the points on the graph. However, depending on the graph, it may be impossible to list all the [latex]x[/latex]-coordinates for the domain and all the [latex]y[/latex]-coordinates for the range (see figure 1). In these situations, there are alternative ways to help us describe the domain and range.
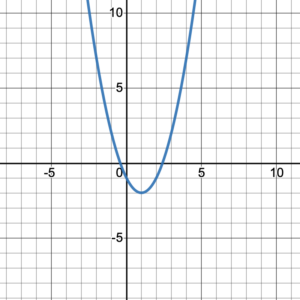
Figure 1.
Interval Notation:
Since the domain of a graph is a set of [latex]x[/latex]-values, we describe the domain of a graph using an interval. Basically, the interval describes the coverage of the graph along a number line. The covered area of the [latex]x[/latex]-coordinates of the graph in figure 1 is from negative infinity to positive infinity. Therefore, the domain is
[latex](-\infty, +\infty)[/latex]
We can do the same with the [latex]y[/latex]-coordinates of the graph to get the range. The covered area of the [latex]y[/latex]-coordinates is from the lowest value of [latex]y[/latex] where the graph turns at –2 to positive infinity. Therefore, the range is
[latex][-2,+\infty)[/latex]
In interval notation a parenthesis ( or ) means the number next to it is not included. On the other hand, a bracket [ or ] means the number next to it is included.
Try It 4
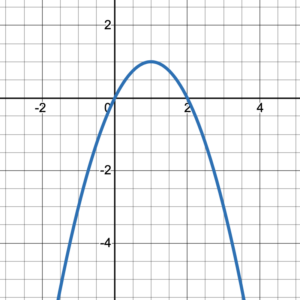
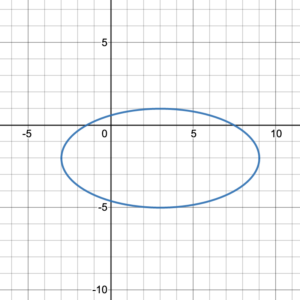
Write the domain and range of the graphed relation in interval notation:
Try It 5
Write the domain and range of the graphed relation, in interval notation:

Set-Builder Notation:
Another way to describe the domain and range is using set-builder notation. Set-builder notation specifies a set as a selection from a larger set, determined by a condition on the elements. Set-builder notation is composed of three elements, the braces (curly brackets), the variable being described, and the conditions on the variable. For example, { [latex]x[/latex] | [latex]x\in\mathbb{R}\text{ and }x > 3[/latex] }. The braces enclose elements of a set. The vertical bar is read, “such that” and the condition on the variable is placed after the vertical bar. It describes and constrains the elements of the set. [latex]x\in\mathbb{R}\text{ and }x > 3[/latex] tells us that the elements of the set are real numbers greater than 3.
The set-builder notation for the domain of the graph in figure 1 is { [latex]x\; | \;\;x\in\mathbb{R}[/latex]}. The statement [latex]x\in\mathbb{R}[/latex] is read [latex]x[/latex] is a real number and is identical to all elements on the [latex]x[/latex]-axis from negative infinity to positive infinity. The set notation for the range will be [latex]\{y\; |\;\;y\in\mathbb{R}\text{ and }y ≥ -2 \}[/latex].
Try It 6
Write the domain and range of the graphed relation in set-builder notation:
Try It 7
Write the domain and range of the graphed relation in set-builder notation:
Candela Citations
- Relations and Functions. Authored by: Hazel McKenna and Leo Chang. Provided by: Utah Valley University. License: CC BY: Attribution
- All graphs created using desmos graphing calculator. Authored by: Hazel McKenna and Leo Chang. Provided by: Utah Valley University. License: CC BY: Attribution
- All Examples and Try Its. Authored by: Hazel McKenna. Provided by: Utah Valley University. License: CC BY: Attribution