Learning Outcomes
- Determine if a pattern is linear
- Determine if a rate of change is constant
- Calculate rate of change
- Explain slope of a line as a constant rate of change
- Describe a line as increasing, decreasing, or neither using slope
- Calculate slope using [latex]m=\frac{\text{rise}}{\text{run}}[/latex]
Linear Patterns and Rate of Change
A linear pattern occurs when the value of a variable increases (or decreases) by exactly the same amount every time. For example the sequence of numbers 1, 3, 5, 7, 9, … shows a linear pattern because the numbers increase by 2 moving from left to right. Another example is the sequence of numbers 12, 6, 0 –6, –12, … where the numbers decrease by 6 (increase by –6) moving from left to right. In both examples, the growth (the difference between adjacent numbers in the sequence) is constant.
Suppose the cost of a meal is $5. Two meals will cost 2 · $5 = $10, three meals will cost 3 · $5 = $15, etc. The sequence $5, $10, $15, $20, … is a linear pattern since the the total cost increases by a constant $5 as the number of meals increase by 1.
| Meal Cost Breakdown |
||||||
|---|---|---|---|---|---|---|
| +1––> | +1––> | +1––> | +1––> | +1––> | ||
| Number of Meals | 1 | 2 | 3 | 4 | 5 | 6 |
| Total Cost | $5 | $10 | $15 | $20 | $25 | $30 |
| +$5––> | +$5––> | +$5––> | +$5––> | +$5––> | ||
Table 1. Example of linear growth.
The growth of a linear pattern is called linear growth. Such growth demands a constant rate of change. Rate of change means the change in value of the dependent variable per the change in value of the independent variable. A constant rate of change means the rate of change is the same number regardless of where the values are selected. For the cost of a meal case shown in table 1, the rate of change is the increase of $5 per 1 meal. Had we moved from 2 meals to 5 meals the price increases from $10 to $25. That is an increase of $15 for 3 more meals, or $5 per meal. The rate of change is a constant at $5 per meal, or a constant rate of change.
LINEAR GROWTH
Linear Growth = Constant Rate of Change
Example 1
Bamboo is the fastest growing plant in the world. The table shows the height of a bamboo shoot in days. The top row contains the number of days, and the bottom row contains height in inches.
| Height of Bamboo Shoots in Days | |||||
|---|---|---|---|---|---|
| Day | 10 | 11 | 12 | 13 | 14 |
| Height | 8 inches | 20 inches | 32 inches | 44 inches | 56 inches |
Determine if this demonstrates linear growth. Explain your reasoning.
Solution
For every 1 day increase in time, there is a 12 inch increase in height: 20in – 8in = 12 in; 32in – 20in = 12in; 44in – 32in = 12in; 56in – 44in = 12in. Since this is a constant rate of change of 12 inches per day, this demonstrates linear growth.
Try It 1
The table shows the cost of tuition at UVU in 2022. The first row shows the number of credits, and the second row shows the cost of tuition in U.S. dollars.
| Cost of Tuition at UVU in 2022 | |||||||
|---|---|---|---|---|---|---|---|
| Credits | 3 | 6 | 9 | 12 | 15 | 18 | 21 |
| Tuition | $830 | $1448 | $2066 | $2684 | $2684 | $2684 | $3302 |
Determine if this demonstrates linear growth. Explain your reasoning.
Calculating the Rate of Change
A rate of change involves two variables, one is the independent variable, and the other is the dependent variable. The rate of change is the degree to which the dependent variable changes as the independent variable changes.
The change in value of each variable is obtained between any two data points. The change in value of the dependent variable is divided by the change in value of the independent variable.
RATE OF CHANGE
Rate of Change = [latex]\dfrac{\text{change in value of dependent variable}}{\text{change in value of independent variable}}[/latex]
Example 2
The table shows the relationship between the time someone has been driving and the distance they have traveled in that time. The first row is the time in hours, and the second row is the distance in miles.
| Driving Versus Distance Traveled | |||||
|---|---|---|---|---|---|
| Time (hours) | 0 | 1 | 2 | 3 | 4 |
| Distance (miles) | 0 | 40 | 100 | 170 | 220 |
- Use the table to determine the rate of change between time = 0 and time = 2.
- Use the table to determine the rate of change between time = 1 and time = 4.
- Is the rate of change constant?
- Does the data represent linear growth? Explain your reasoning.
Solution
1. Change in time from 0 hours to 2 hours = 2 hours and change in distance from 0 miles to 100 miles = 100 miles.
Rate of change = [latex]\dfrac{\text{change in value of dependent variable}}{\text{change in value of independent variable}} = \frac{100\text{ miles}}{2\text{ hours}}= 50[/latex] miles per hour.
2. Change in time from 1 hour to 4 hours = 3 hours and change in distance from 40 miles to 220 miles = 180 miles.
Rate of change = [latex]\dfrac{\text{change in value of dependent variable}}{\text{change in value of independent variable}} = \frac{180\text{ miles}}{3\text{ hours}}= 60[/latex] miles per hour.
3. No. The rates of change in 1 and 2 above are not equal.
4. No. The rate of change is not constant across all data points.
Try It 2
The table shows the relationship between the length of a shoe and US men’s shoe sizes. The first column is shoe size, and the second column is the shoe length in centimeters.
| US Men’s Shoe Sizes | |
|---|---|
| Shoe size | Length of shoe (cm) |
| 8 | 24.1 |
| 8.5 | 24.6 |
| 9 | 25.1 |
| 9.5 | 25.4 |
| 10 | 25.9 |
| 10.5 | 26.2 |
- Use the table to determine the rate of change between a size 8 and a size 9.
- Use the table to determine the rate of change between a size 9.5 and a size 10.5.
- Is the rate of change in shoe size constant? Explain your reasoning.
- Does the data represent linear growth? Explain your reasoning.
When it comes to functions in equation form, the dependent variable is the function value, which depends on the value of the independent variable.
Example 3
For the function [latex]f(x)=x^2[/latex], find the rate of change between:
- [latex]x=-2[/latex] and [latex]x=2[/latex]
- [latex]x=0[/latex] and [latex]x=2[/latex]
Is the rate of change linear?
Solution
1.
The independent variable is [latex]x[/latex] changes from –2 to 2. So the change in [latex]x[/latex] is 4.
The dependent variable is the function value. [latex]f(-2)=(-2)^2=4[/latex] and [latex]f(2)=(2)^2=4[/latex]. So the change in value of the dependent variable is 0.
Therefore, Rate of change = [latex]\dfrac{\text{change in value of the dependent variable}}{\text{change in value of the independent variable}}=\dfrac{0}{4} = 0[/latex].
2.
The independent variable is [latex]x[/latex]. So the change in the independent variable from 0 to 2 is 2.
The dependent variable is the function value. [latex]f(0)=(0)^2=0[/latex] and [latex]f(2)=(2)^2=4[/latex]. So the change in value of the dependent variable from 0 to 4 is 4.
Therefore, Rate of change = [latex]\frac{\text{change in value of the dependent variable}}{\text{change in value of the independent variable}} = \dfrac{4}{2} = 2[/latex].
The rate of change is NOT linear because it is not constant between different data points.
Try It 3
For the function [latex]f(x)=3x-5[/latex], find the rate of change between:
- [latex]x=-2[/latex] and [latex]x=0[/latex]
- [latex]x=3[/latex] and [latex]x=4[/latex]
Is the rate of change linear? Show what this means graphically (use Desmos).

Constant Rate of Change and Slope
If the rate of change of a function is constant, then that function is linear. Consider the data in table 1. The data shows the cost of buying tickets for a school play. The first row is the number of tickets, and the second row is the cost in U.S. dollars.
| Cost of Buying Tickets | |||||||
|---|---|---|---|---|---|---|---|
| No. of Tickets | 1 | 2 | 3 | 4 | 5 | 6 | 7 |
| Cost | $8 | $16 | $24 | $32 | $40 | $48 | $56 |
| Table 1. The cost of buying tickets | |||||||
The rate of change of this data is $8 per ticket and is constant across data points. Consequently, this is a linear function. If we graph these data points as coordinates [latex](x,y) = \left ( \text{No. of tickets, Cost }\right)[/latex], the graph shows that the data points lie on a line (Figure 1).

Figure 1. Cost of tickets.
The graph of a linear function is a line. The rate of change of this line is $8 per ticket. This means that for every 1 ticket increase the cost increases by $8.
The slope of a line is a measure of the steepness of the line, and since the steepness is the same all along the line, the slope is constant. The slope of a line is defined as the ratio of [latex]\frac{\text{rise}}{\text{run}}[/latex] where rise is the change in [latex]y[/latex]-values and run is the corresponding change in [latex]x[/latex]-values. If [latex]y=f(x)[/latex], then slope = [latex]\frac{\text{rise}}{\text{run}}=\frac{\text{change in function values}}{\text{change in }x\text{-values}}[/latex]. This is the exact definition of rate of change, so the rate of change of a linear function is the constant slope between any two data points on the line. The letter [latex]m[/latex] is generally used to represent slope.
For a linear function whose graph is a line,
Slope of the line = [latex]m=\frac{\text{rise}}{\text{run}}[/latex]
Rate of change of the function = [latex]\frac{\text{change in value of the function value}}{\text{change in value of independent variable}}=\frac{\text{rise}}{\text{run}}[/latex]
therefore
Slope of the graphed line = Rate of Change of the function
Using the graph in figure 1, the slope of the line is [latex]m=\frac{\text{rise}}{\text{run}}=\frac{48}{6}=8[/latex].

Figure 2. Slope of a line
The units for slope are always [latex]\dfrac{\text{units for the function output}}{\text{units for the function input}}[/latex], the change of output value for each unit of change in input value. For the graph in figure 1, the units are $ per ticket. So the slope = the rate of change of the function = $8 per ticket.
Slope of a linear function
The slope, or rate of change, of a linear function is constant:
[latex]m=\dfrac{\text{change in output (rise)}}{\text{change in input (run)}}[/latex]
When the slope of a graphed linear function is positive, the line is moving in an uphill direction from left to right across the coordinate plane. This is also called an increasing linear function. Likewise, a decreasing linear function is one whose slope is negative. The graph of a decreasing linear function is a line moving in a downhill direction from left to right across the coordinate plane. When the slope equals zero, there is zero rate of change so the graph is neither increasing nor decreasing; it stays the same. The result is a horizontal line. When a line is vertical, it’s slope is undefined. This is because the run or change in [latex]x[/latex] is zero, and it is impossible to divide by 0. However, we must remember that a vertical line is NOT a function.

Figure 3. Slopes.
Example 4
Use the graph to determine whether the rate of change (slope) of each line is positive, negative, zero, or undefined.

Solution
Line A is increasing so has a positive slope.
Line B is vertical so has an undefined slope.
Line C is decreasing so has a negative slope.
Line D is increasing so has a positive slope.
Line E is horizontal so has a slope of zero.
Try It 4
Use the graph to determine whether the rate of change (slope) of each line is positive, negative, zero, or undefined.

If a function is not linear, it’s graph is not a line. Consider the function [latex]f(x)=x^2[/latex]. The rate of change between the points (–2, 4) and (2, 4) is zero because the [latex]y[/latex]-value stays the same. This results in the horizontal line with a slope of zero between the points as shown in figure 4. The slope between the points (0, 0) and (2, 4) is 2 because the rise from 0 to 4 is 4 and the run from 0 to 2 is 2; slope = [latex]m=\frac{\text{rise}}{\text{run}}=\frac{4}{2}=2[/latex]. See the 3rd example in this section.
Figure 4 shows the graph of the function [latex]f(x)=x^2[/latex] along with the slopes between each pair of points.
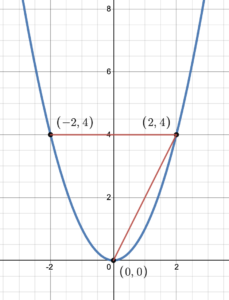
Figure 4. Graph of y=x^2 showing non constant rate of change.
Notice that the red line segments on the graph represent the rate of change. Since these line segments do not go in the same direction, the slopes of these line segments are not equal, meaning the [latex]x[/latex] and [latex]f(x)[/latex] values change at different speeds. Consequently, the rate of change is not constant.
Figure 5 shows the graph of the function [latex]f(x)=3x-5[/latex] which is a line. The rate of change between the points (–2, –11) and (0, –5) is identical to the rate of change between the points (3, 4) and (4, 7) and equals the slope of the line, [latex]m=3[/latex].
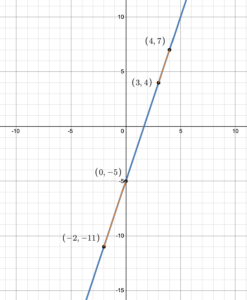
Figure 5. Graph of linear function [latex]f(x)=3x-5[/latex] showing constant rate of change
The red line segments go in the same direction, which means that the slopes, and therefore the rates of change, are identical and constant.
Example 5
The population of a city increased from [latex]23,400[/latex] to [latex]27,800[/latex] between [latex]2018[/latex] and [latex]2022[/latex]. Find the change of population per year from [latex]2018[/latex] to [latex]2022[/latex].
Solution
The rate of change relates the change in population to the change in time. The population increased by [latex]27,800-23,400=4,400[/latex] people over the 4-year time interval. To find the rate of change, divide the change in the number of people by the number of years.
[latex]\dfrac{4,400\text{ people}}{4\text{ years}}=1100\text{ }\dfrac{\text{people}}{\text{year}}[/latex]
So the population increased by 1,100 people per year.
Because we are told that the population increased, we would expect the slope to be positive. This positive slope we calculated is therefore reasonable.
Note
We are not told that the population increases the same amount from year to year, therefore we do not know that a linear function relates the city population to the year. For example, there could have been a population increase of 0, 0, 0, then 1100 in each of the four years. The rate of change we found is the average rate of change over 4 years. On average, there was a population increase of 1,100 people per year.
Try It 5
If a car costs $36,000 when new, and the same model costs $28,400 when it is 2 years old, what is the rate of change of the cost of the car by age?
Candela Citations
- Linear Patterns and Rate of Change, Calculating the Rate of Change, and Slope. Authored by: Hazel McKenna and Leo Chang. Provided by: Utah Valley University. License: CC BY: Attribution
- All examples and Try Its. Authored by: Hazel McKenna. Provided by: Utah Valley University. License: CC BY: Attribution
- All graphs created using Desmos graphing calculator. Authored by: Hazel McKenna. Provided by: Utah Valley University. Located at: http://Desmos.com. License: CC BY: Attribution